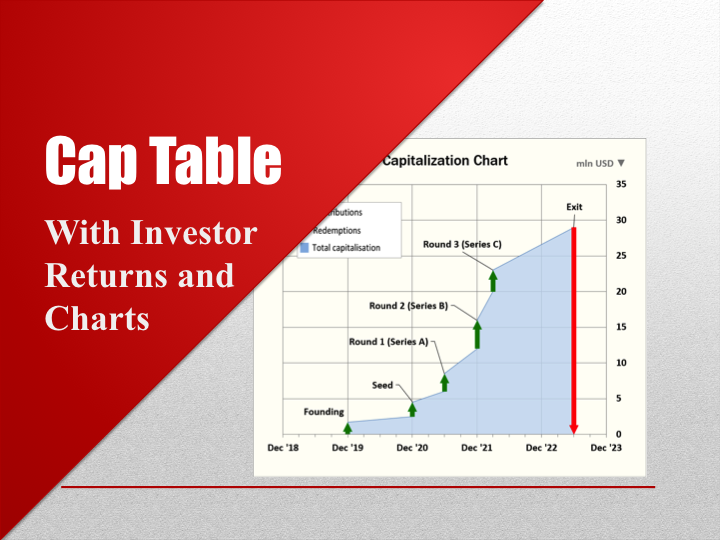
Cap Table with Investor Returns and Charts
Type of Business :
Financial Models
Price : USD 25 25.00
What's New

Type of Business :
Price : USD 25 25.00