
Dashboards
Dashboards are information management tools used to track KPIs, metrics, and key data points related to a business, department, or specific process. Dashboards aggregate and visualize data from multiple sources. B. Databases, locally hosted files, and web services. You can use dashboards to view historical trends, actionable data, and real-time information to monitor your business performance.
Dashboards are actually named after car dashboards and are used in much the same way. As an example, consider a car. Looking under the hood, there can be hundreds of processes that affect the performance of the vehicle. The car dashboard uses visualizations to summarize this, so you can focus on what's most important: drive your car safely.
For enterprises, looking "inside", there are hundreds of processes that impact performance. And with the wealth of data available today, it can be difficult to manage and derive value. Simplifying data analysis and distribution using tools such as dashboards can help businesses refresh their engines and make smarter, better, faster data-driven decisions1 There are two ways.
A well-designed dashboard also enhances your approach to information management. Everyone in the company asks about business performance, such as campaign performance, new wins, and churn rates, regardless of role. The dashboard answers these questions in one place for everyone (and metrics).
As a high level reporting mechanism, dashboards ultimately provide fast `big picture` answers to critical business questions and assist and benefit decision-making in several ways:
• Communicating how a business is performing according to defined targets
• Improving informational awareness for everyone
• Organizing operational data into a well-managed format
• Visualizing complex relationships in an easy to understand way
Dashboards connect to files, APIs, and services and organize reports (metrics and dimensional views of data) into different combinations to provide end users a full understanding of their key metrics and drivers. It displays metrics and KPIs as a tabular or cross tabular report, or as one or more data visualizations such as charts, graphs, and maps. Dashboards can also include user-defined filters, images, and text, or include more than one screen tab of information.
Dashboards increase data accessibility and transparency across the business and are helpful for both regular business users and advanced data analysts in monitoring operational health and gleaning high-level insights into performance, before further analysis in advanced tools.
Icrest models provide a varied category of the dashboard which can be helpful for analytical problems.
Check out our latest templates regarding dashboard –
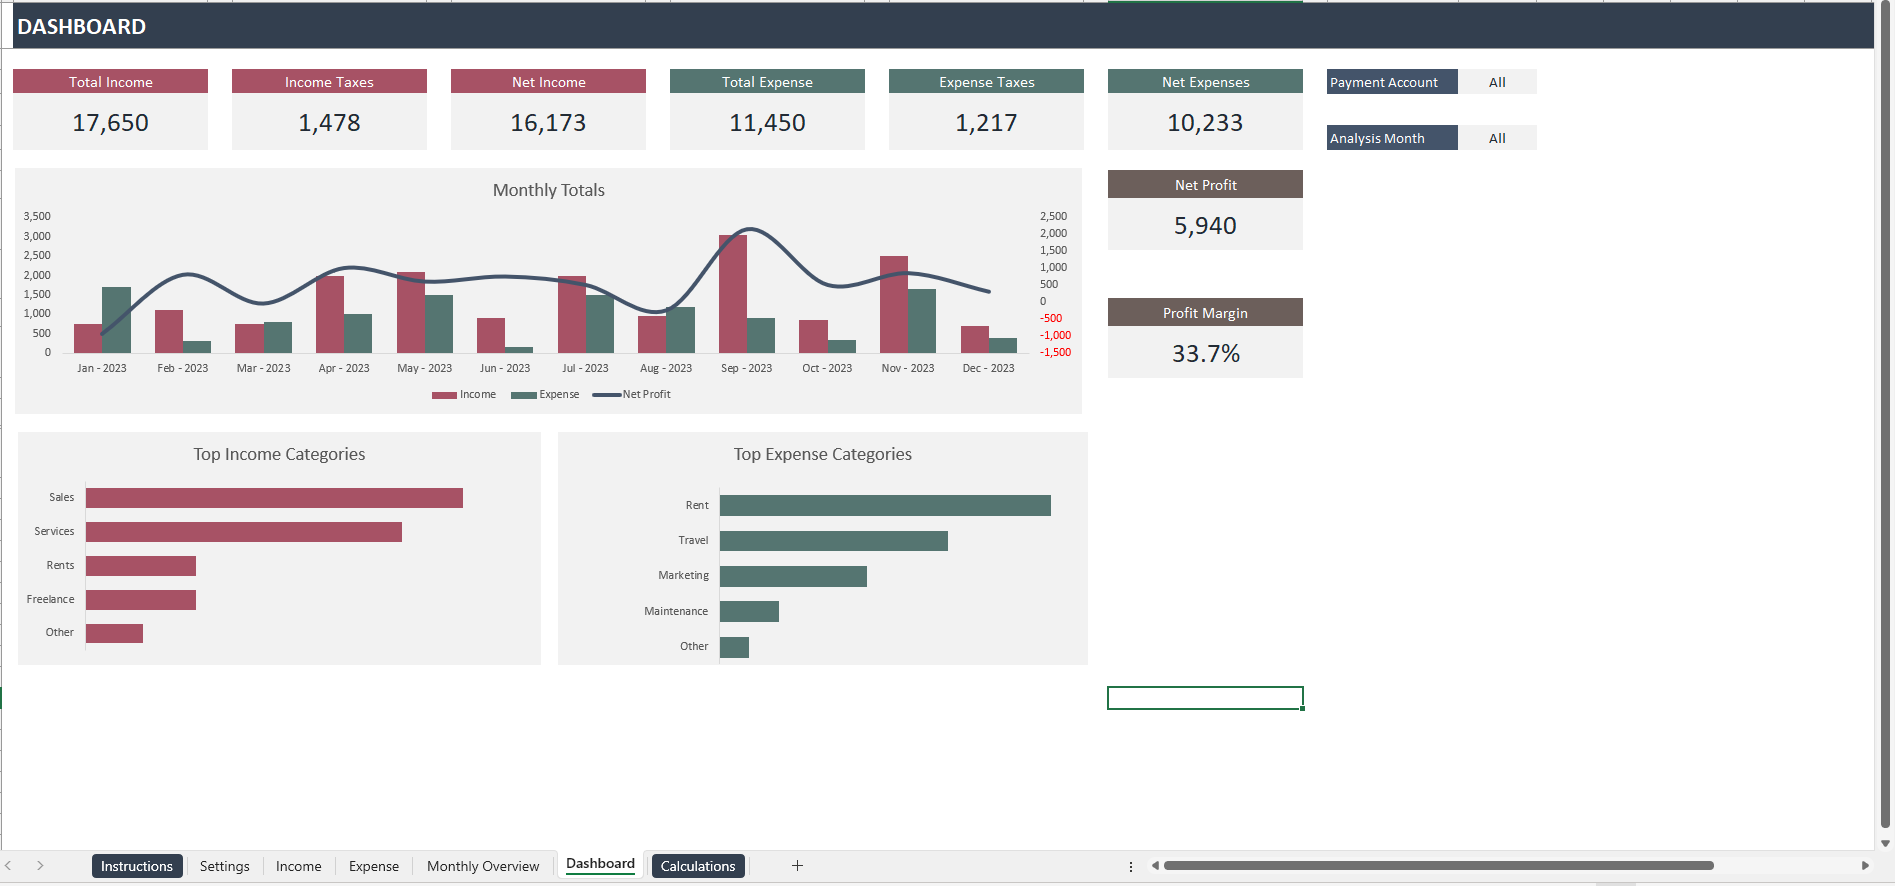
Dashboard For Digital Marketing
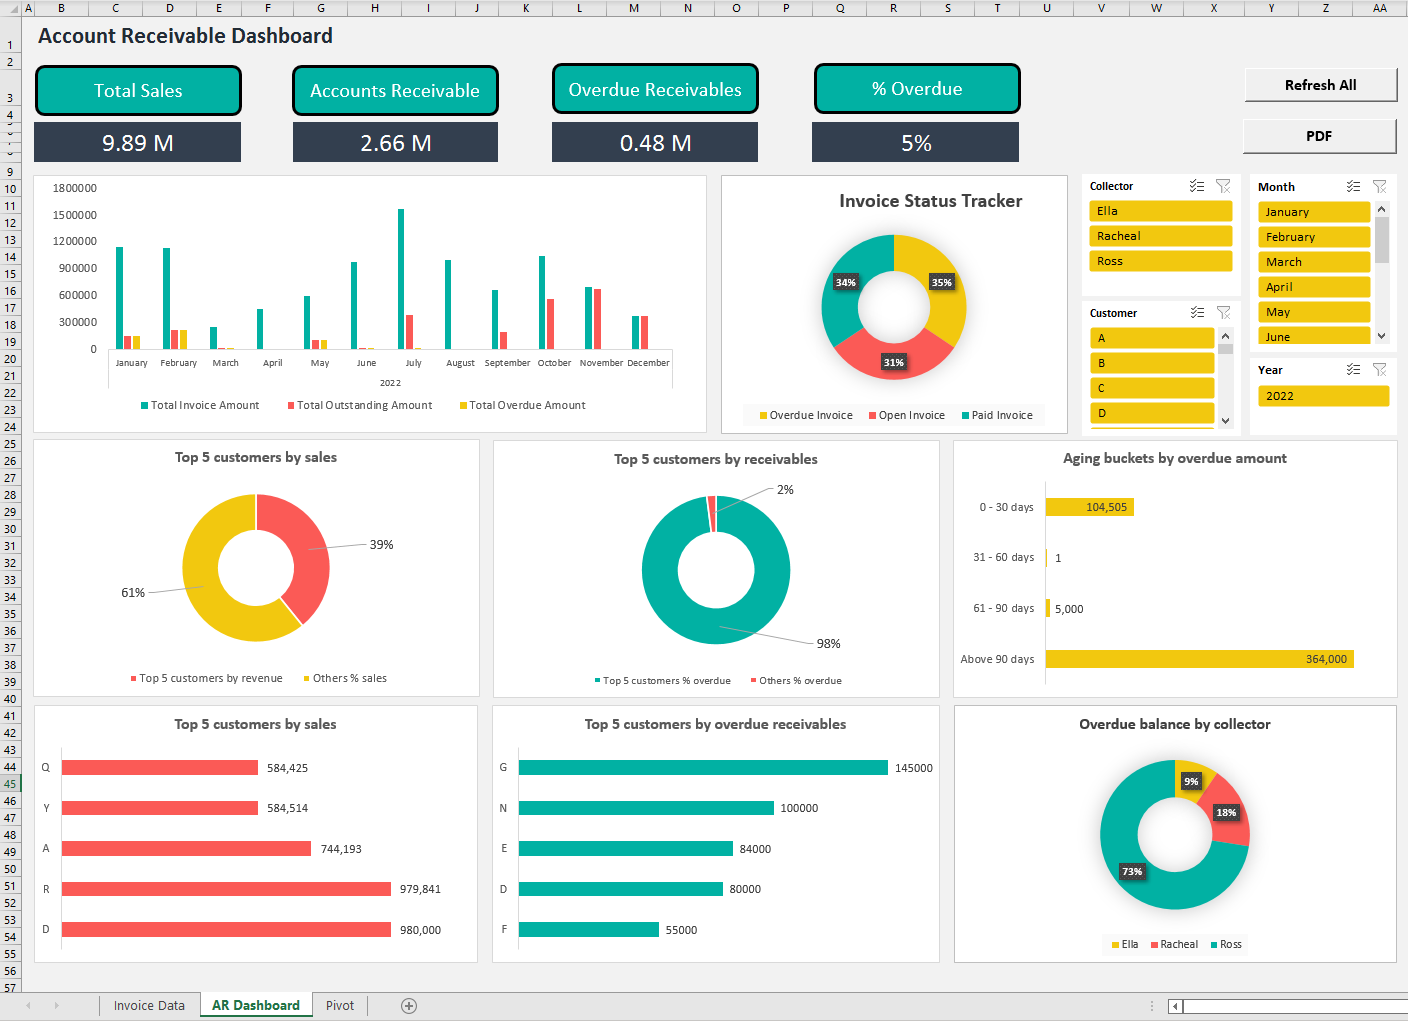
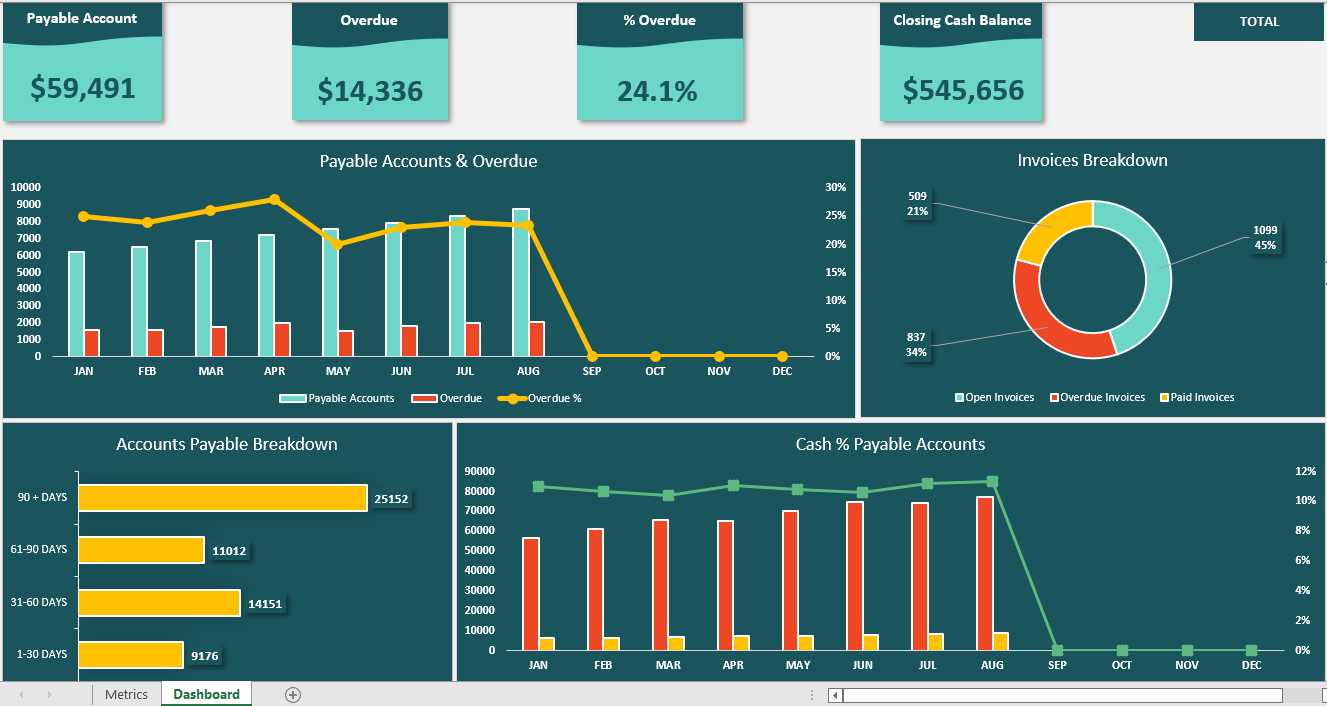
Dashboard For Financial Overview
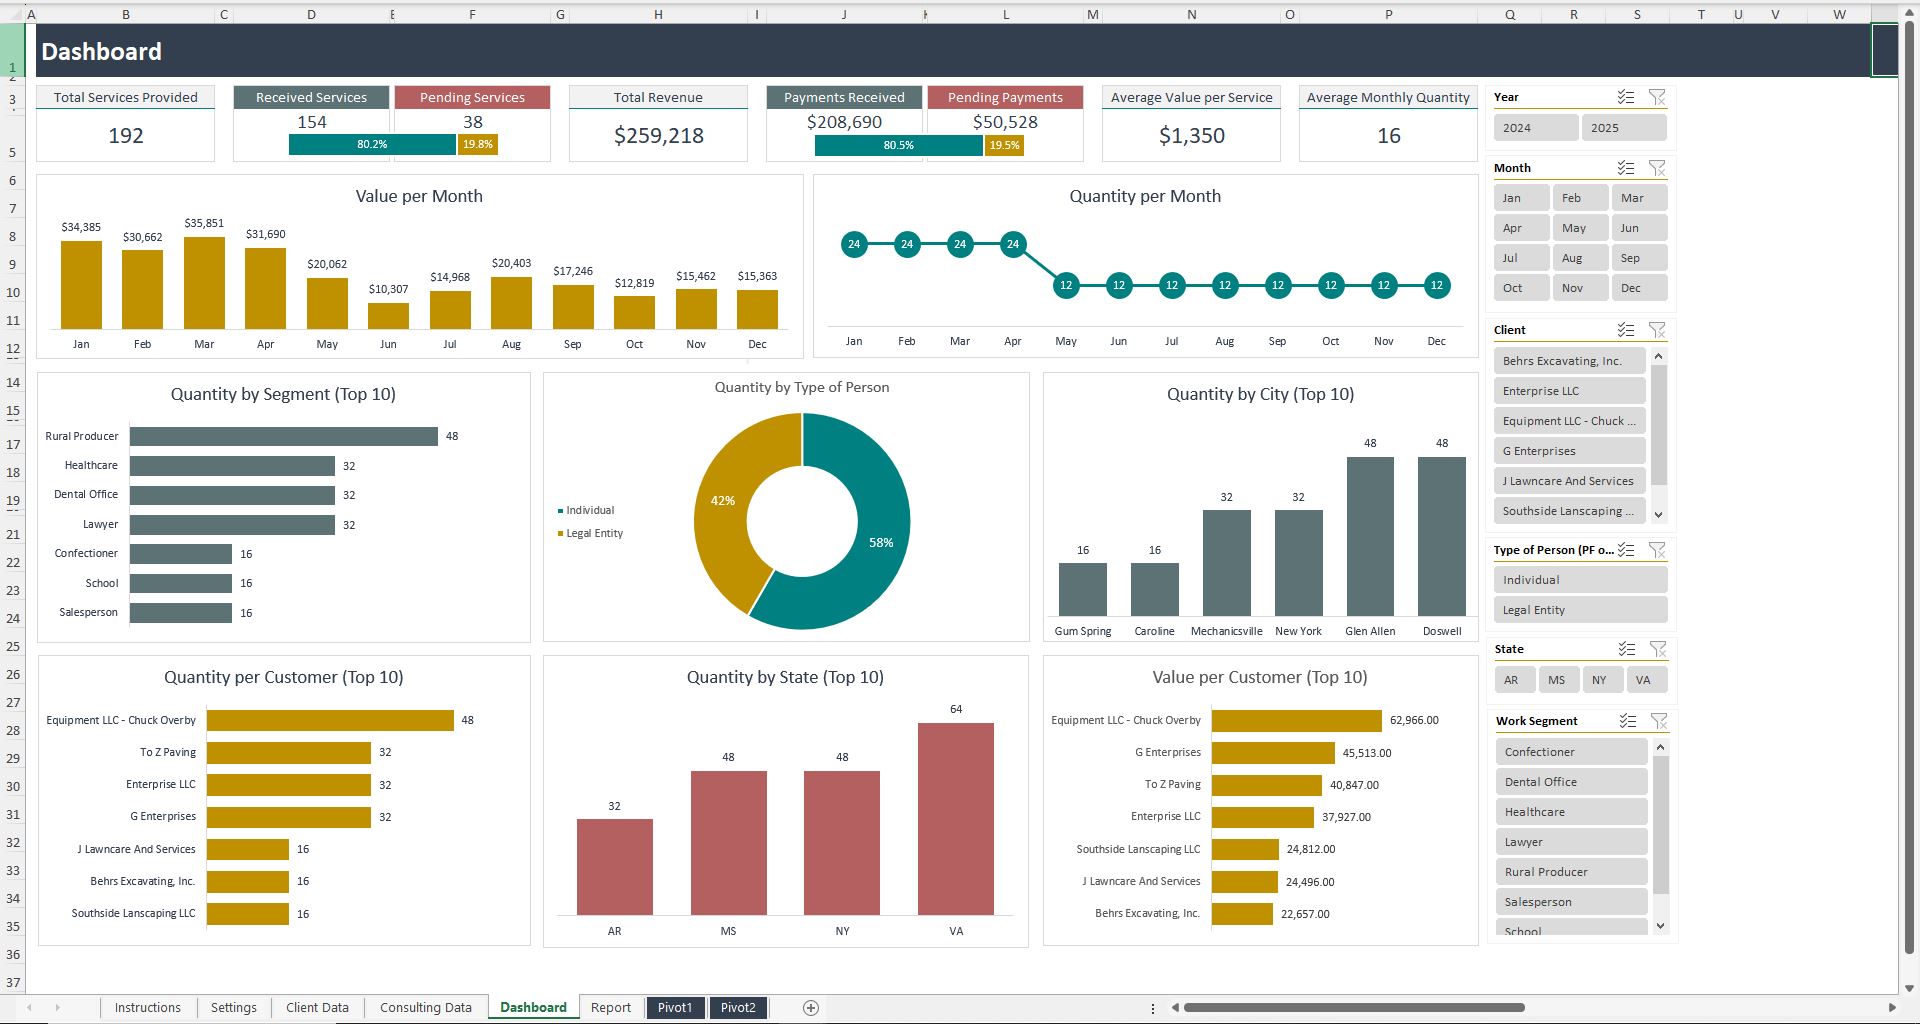
Dashboard For Project Management