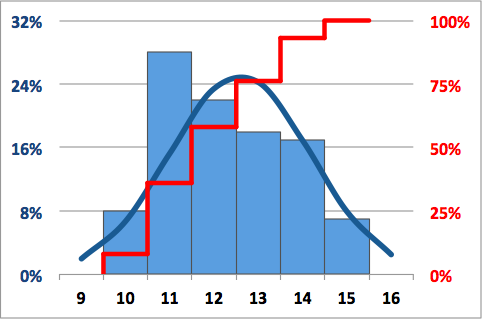
Statistics is a discipline of applied mathematics that deals with the gathering, describing, analysing, and inferring conclusions from numerical data. Differential and integral calculus, linear algebra, and probability theory are all used substantially in statistical theories.
Statisticians are especially interested in learning how to derive valid conclusions about big groups and general events from the behaviour and other observable characteristics of small samples. These small samples reflect a subset of the larger group or a small number of occurrences of a common occurrence.
Statistics is used mainly to gain an understanding of the data and focus on various applications. Statistics is the process of collecting data, evaluating data, and summarizing it into a mathematical form. Initially, statistics were related to the science of the state where it was used in the collection and analysis of facts and data about a country such as its economy, population, etc. Mathematical statistics applies mathematical techniques like linear algebra, differential equations, mathematical analysis, and theories of probability.
There are two methods of analyzing data in mathematical statistics that are used on a large scale:
- Descriptive Statistics
- Inferential Statistics
Descriptive statistics, which explains the qualities of sample and population data, and inferential statistics, which uses those properties to test hypotheses and make conclusions, are the two major disciplines of statistics.
The collection of observations and facts is known as data. These observations and facts can be in the form of numbers, measurements, or statements. There are two different kinds of data i.e. Qualitative data and quantitative data. Qualitative data is when the data is descriptive or categorical and quantitative data is when the data is numerical information. Once we know the data collection methods, we aim at representing the collected data in different forms of graphs such as a bar graph, line graph, pie chart, stem and leaf plots, scatter plot, and so on. Before data analysis, outliers due to the invariance of data measurements are removed. Consider different ways in which statistics represent data.
We at Icrest Models provide customized as well as readymade templates for the statistics tools.


