Sign Up, Its Free

Join our Affiliate Program by simply copying the link of our products on your site and earn affiliate commission on every sale

Are you a Marketing expert, having some strategic tools? Come and Join as our Vendor

If you are a Vendor looking to sell tools in any specific category which is not present at the moment on our platform, for instance, say "Branding and Strategy." Simply, email us along with one of your sample business tools on "[email protected]" and we will add the same after verifying.

We have our showcased inventory as well so that the upcoming vendors can view the quality of business tools we are looking for.

What's New

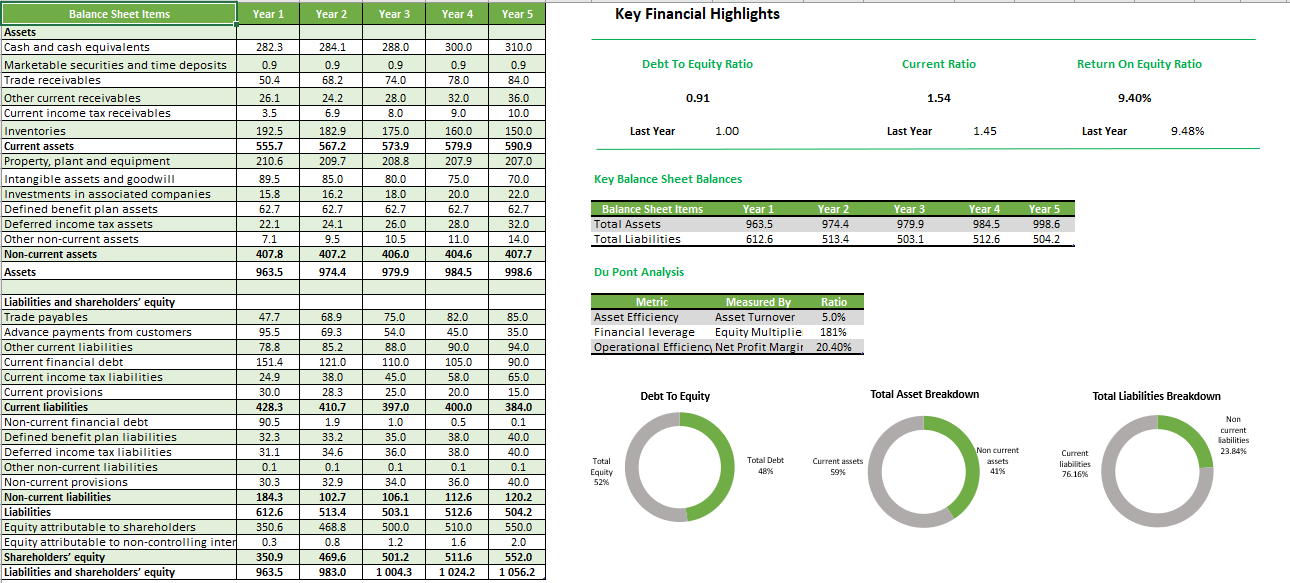
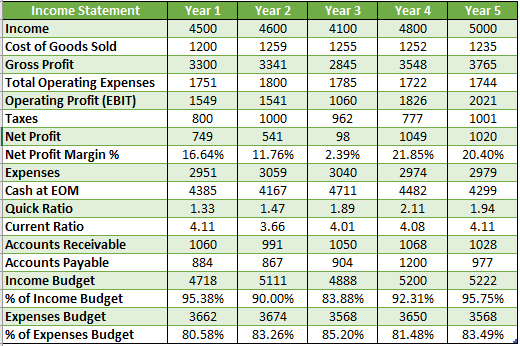
Dashboard For Consolidated Financial Statement
Team Icrest    

Type of Business :

Dashboards

Price : USD 25 25.00

Need More Clarifications/Customized Tool? Generate Ticket

Add to Wishlist icrest approved product

  • Short Description

    This Excel template is built to have an insight on the key financial information of the business. The user can add the data and other relevant details as per their business and, it will populate the graphical representations and figures in the dashboard sheet to give an analytical insight into the business.

  • Full Description

    To understand any business, there is need to understand how that particular business is performing. The consolidated Statements help an investor to get an overall picture of the financial performance of the group of companies as a whole rather than looking at the individual performance. Thus, these statements play a very important role in helping the investors to make proper investment decisions. In order to understand the performance of individual or a group of companies, the financial statement analysis plays a very crucial role. The Financial statement analysis is used to identify the trends and relationships between financial statement items. Both internal management and external users (such as analysts, creditors, and investors) of the financial statements need to evaluate a company's profitability, liquidity, and solvency. In general, financial statements are centered around generally accepted accounting principles (GAAP) in the U.S. These principles require a company to create and maintain three main financial statements: the balance sheet, the income statement, and the cash flow statement. Public companies have stricter standards for financial statement reporting. Public companies must follow GAAP standards which requires accrual accounting. Private companies have greater flexibility in their financial statement preparation and also have the option to use either accrual or cash accounting. To evaluate and perform the financial statement analysis, ratio analysis is done in this dashboard. Financial ratios help investors break down the enormous amount of financial data that's reported by companies. A ratio is merely a metric to help analyze the data and make useful comparisons with other companies and other reporting periods. Financial ratio analysis analyzes specific financial line-items within a company's financial statements to provide insight as to how well the company is performing. Ratios determine profitability, a company's indebtedness, the effectiveness of management, and operational efficiency. It's important to consider that the results from financial ratios are often interpreted differently by investors. Although financial ratio analysis provides insight into a company, they should be used in accordance with other metrics and evaluated against the overall economic backdrop. The sheet contains a tab named dashboard, where all the analytical visual populates as per the data provided. The user needs to update the actual income statement and balance sheet of their business in order to analyze the performance of the business for the specific period. The analysis includes calculating ratios such as Debt to Equity ratio, Current ratio, and Return on Equity (ROE) ratio. It also includes key balance sheet items, and Du Pont analysis. This dashboard will be very useful to the CFO and other stakeholders to understand the performance of the business in a particular month, or year.

  • Table of Content
    No. Content
    1 Cover Page
    2 Instructions
    3 Dashboard
    4 Income Statement
  • Reviews

    No Review. Write a review and be the first.

Related Products