Sign Up, Its Free

Join our Affiliate Program by simply copying the link of our products on your site and earn affiliate commission on every sale

Are you a Marketing expert, having some strategic tools? Come and Join as our Vendor

If you are a Vendor looking to sell tools in any specific category which is not present at the moment on our platform, for instance, say "Branding and Strategy." Simply, email us along with one of your sample business tools on "[email protected]" and we will add the same after verifying.

We have our showcased inventory as well so that the upcoming vendors can view the quality of business tools we are looking for.

What's New

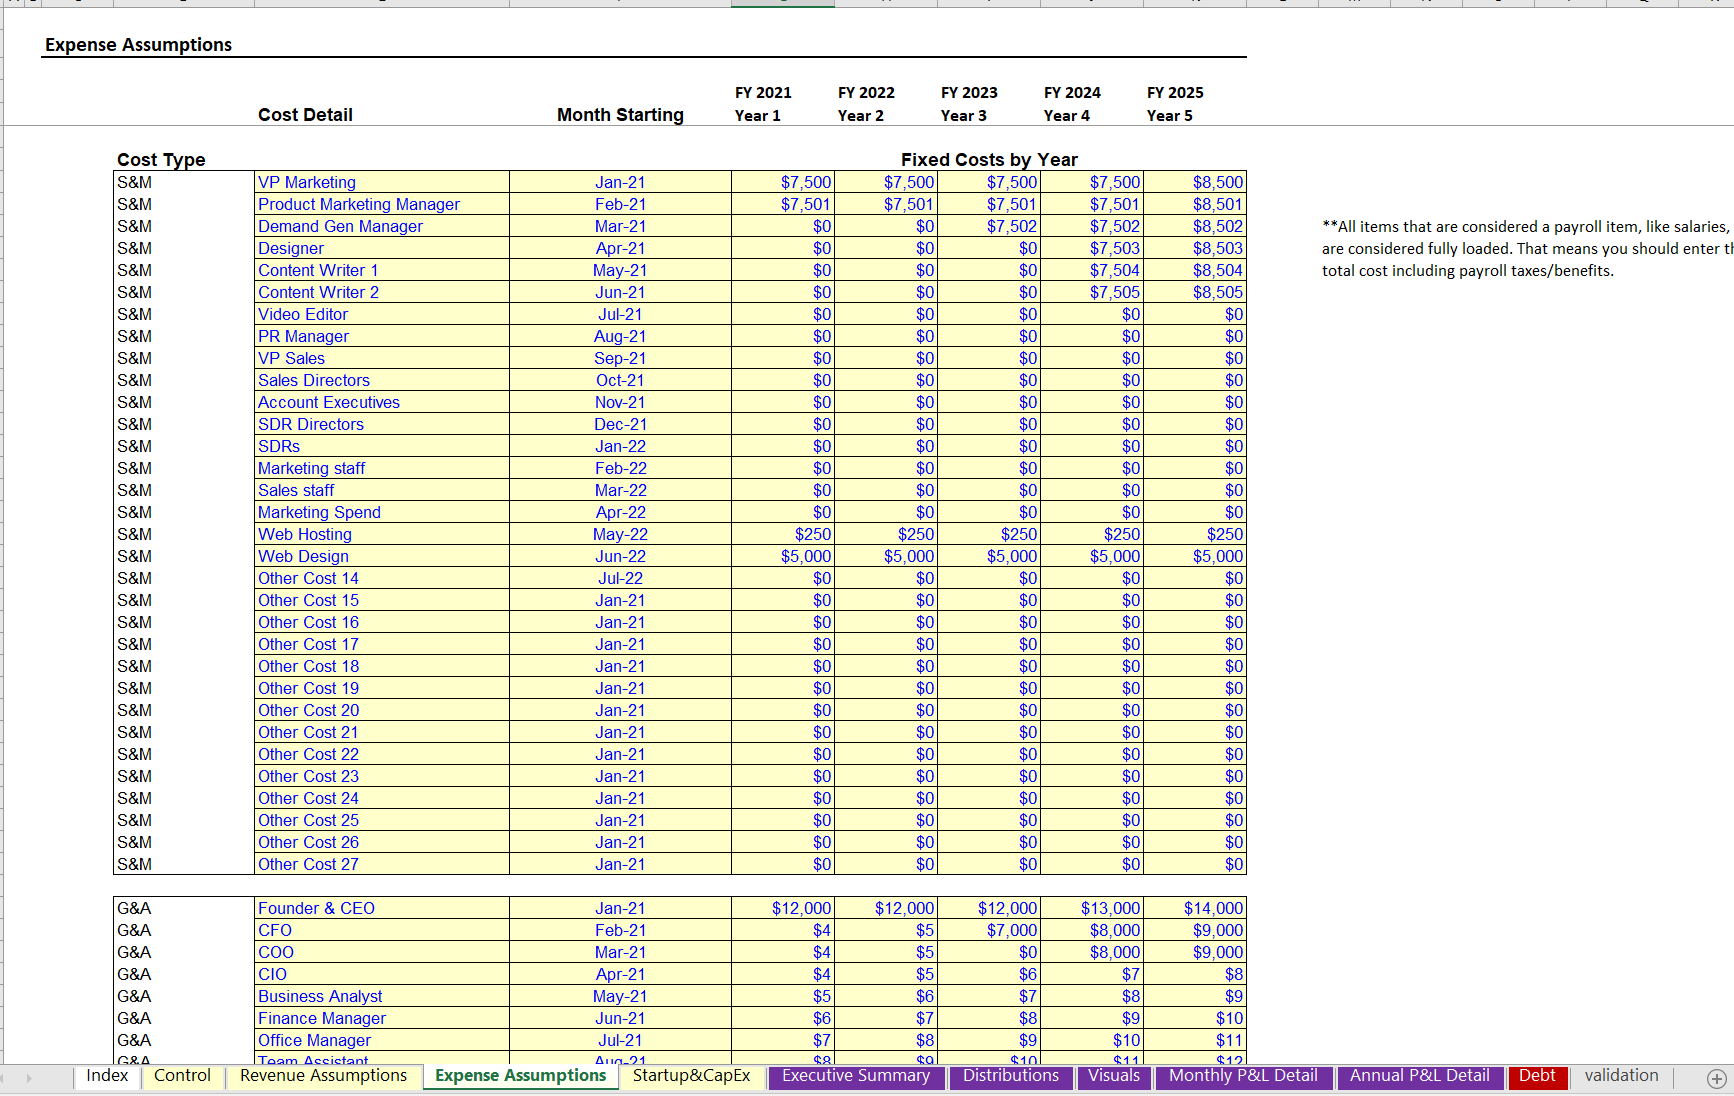
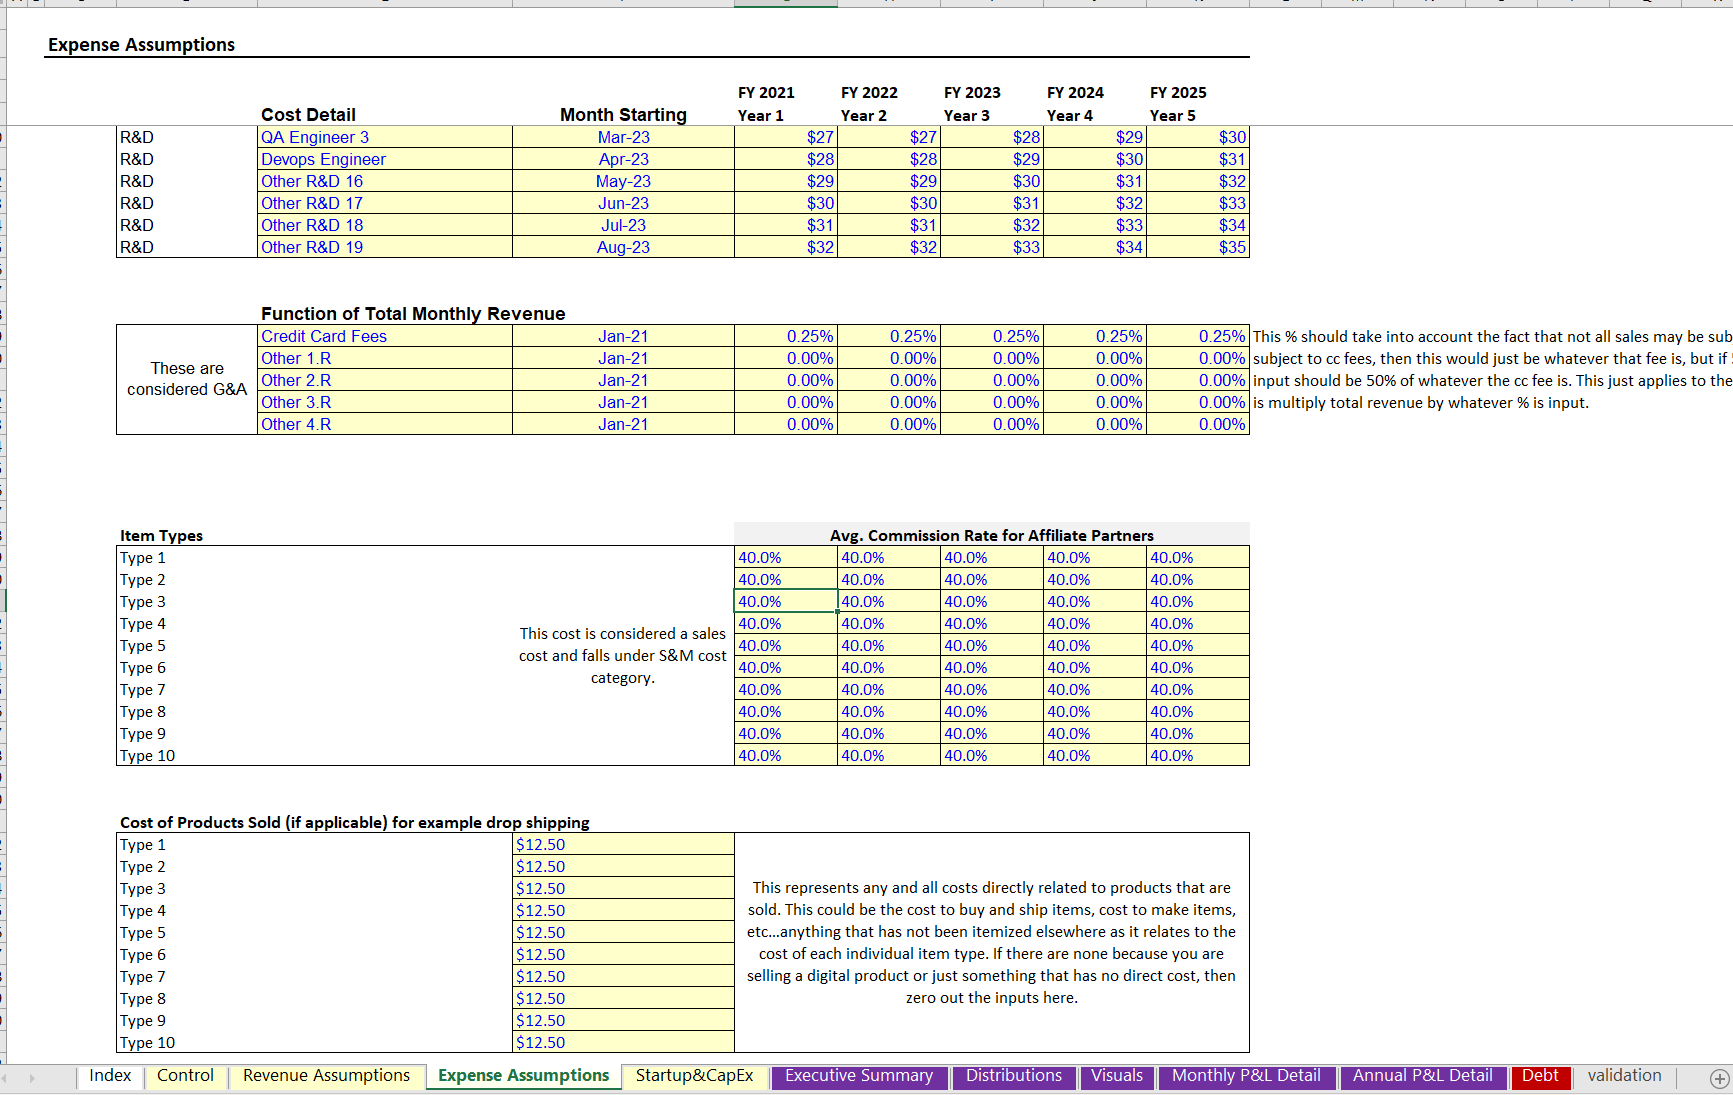
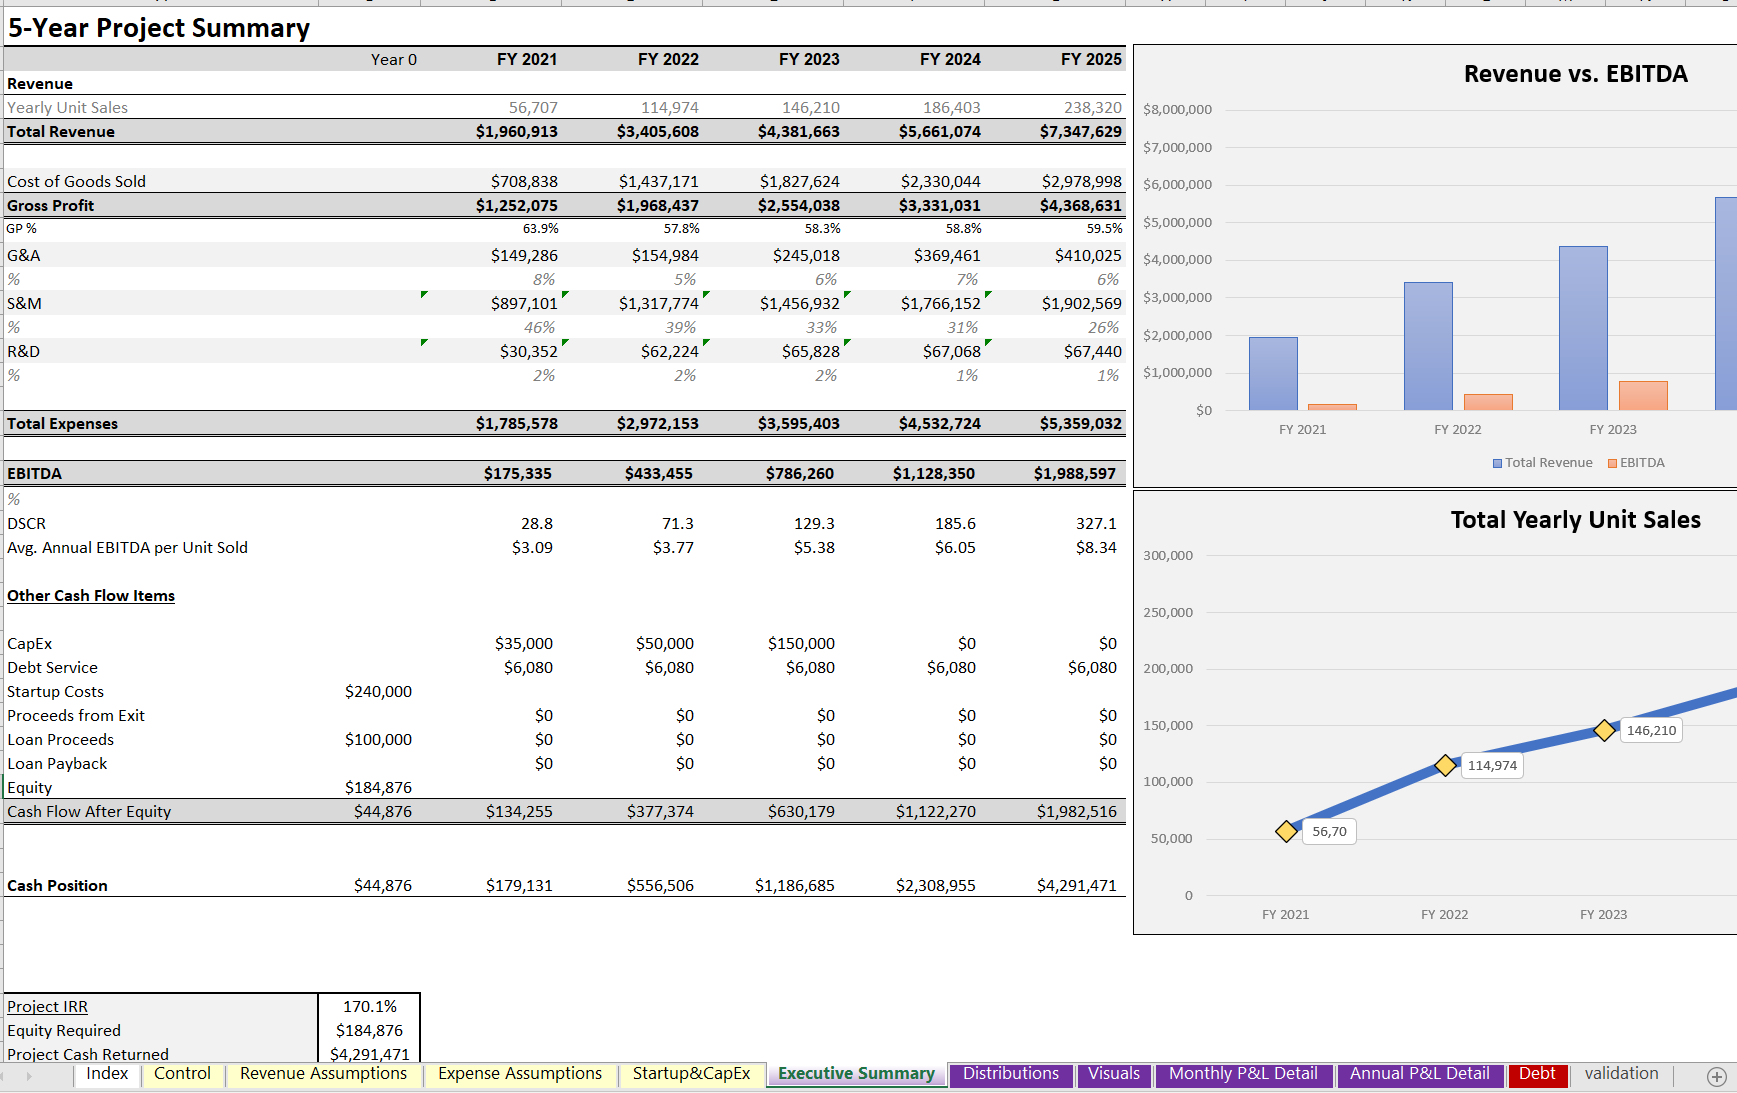
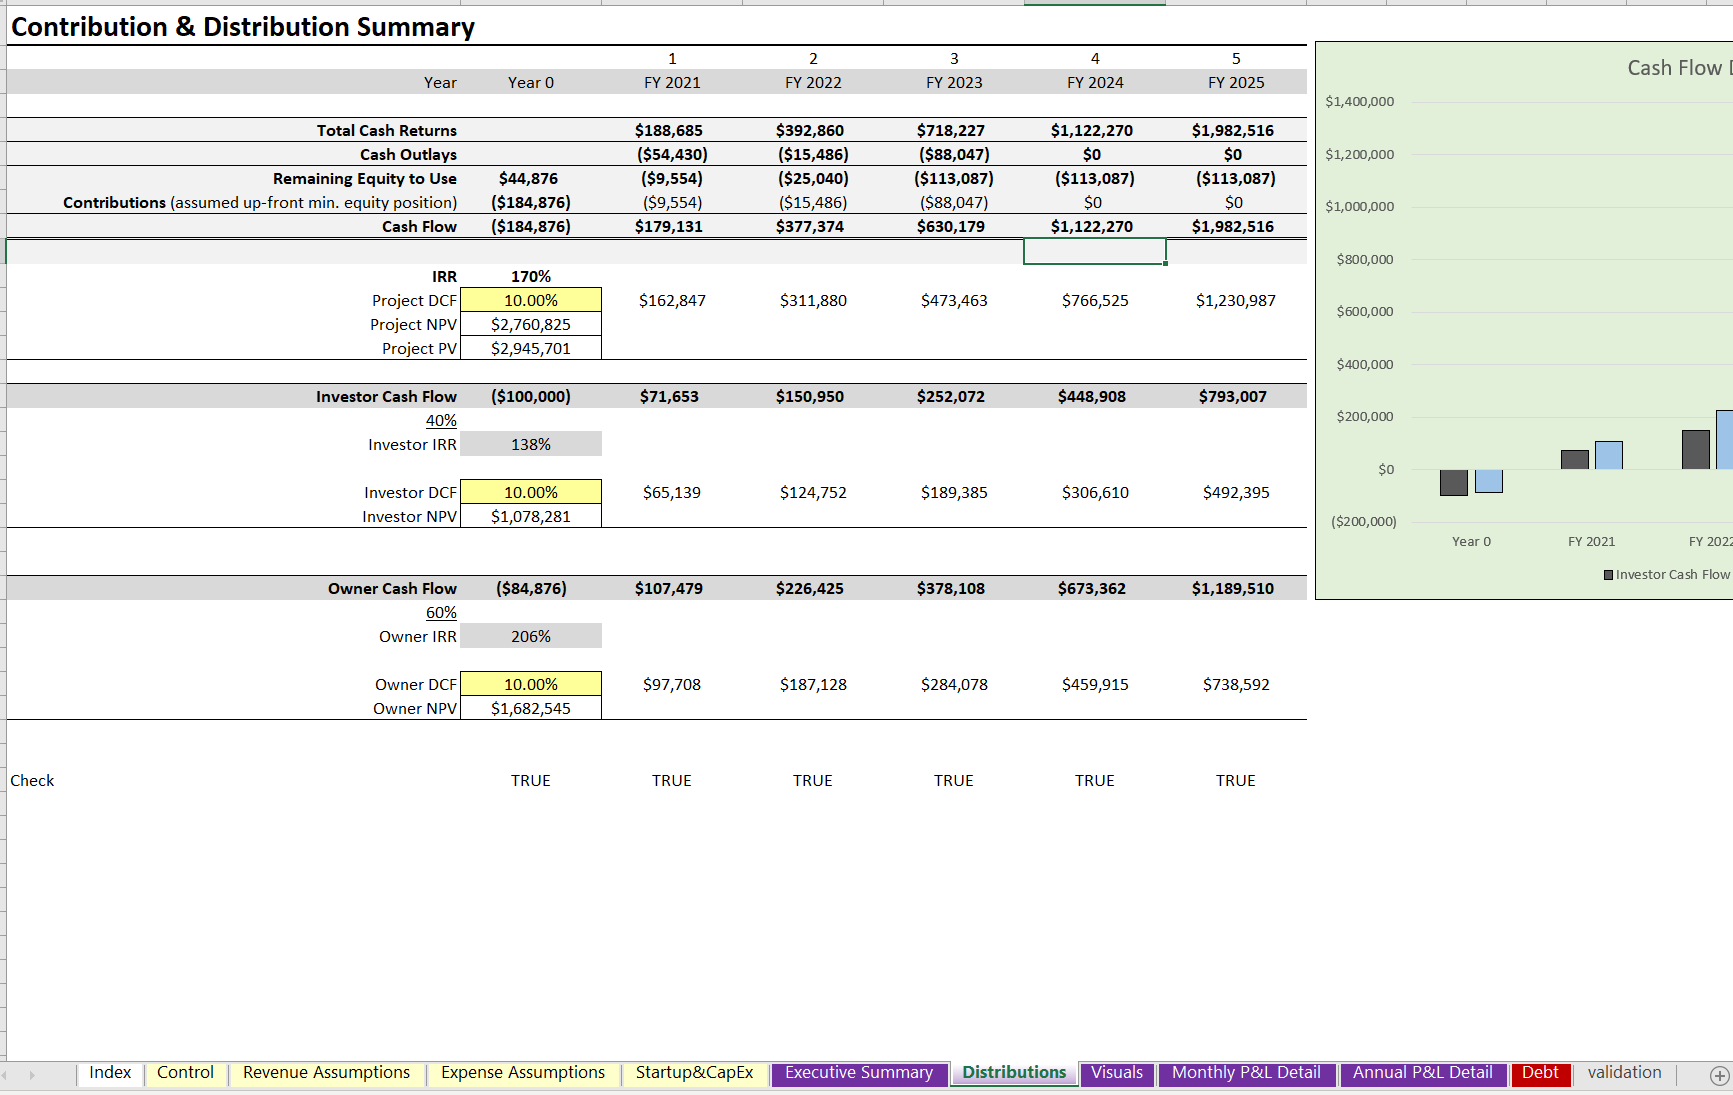
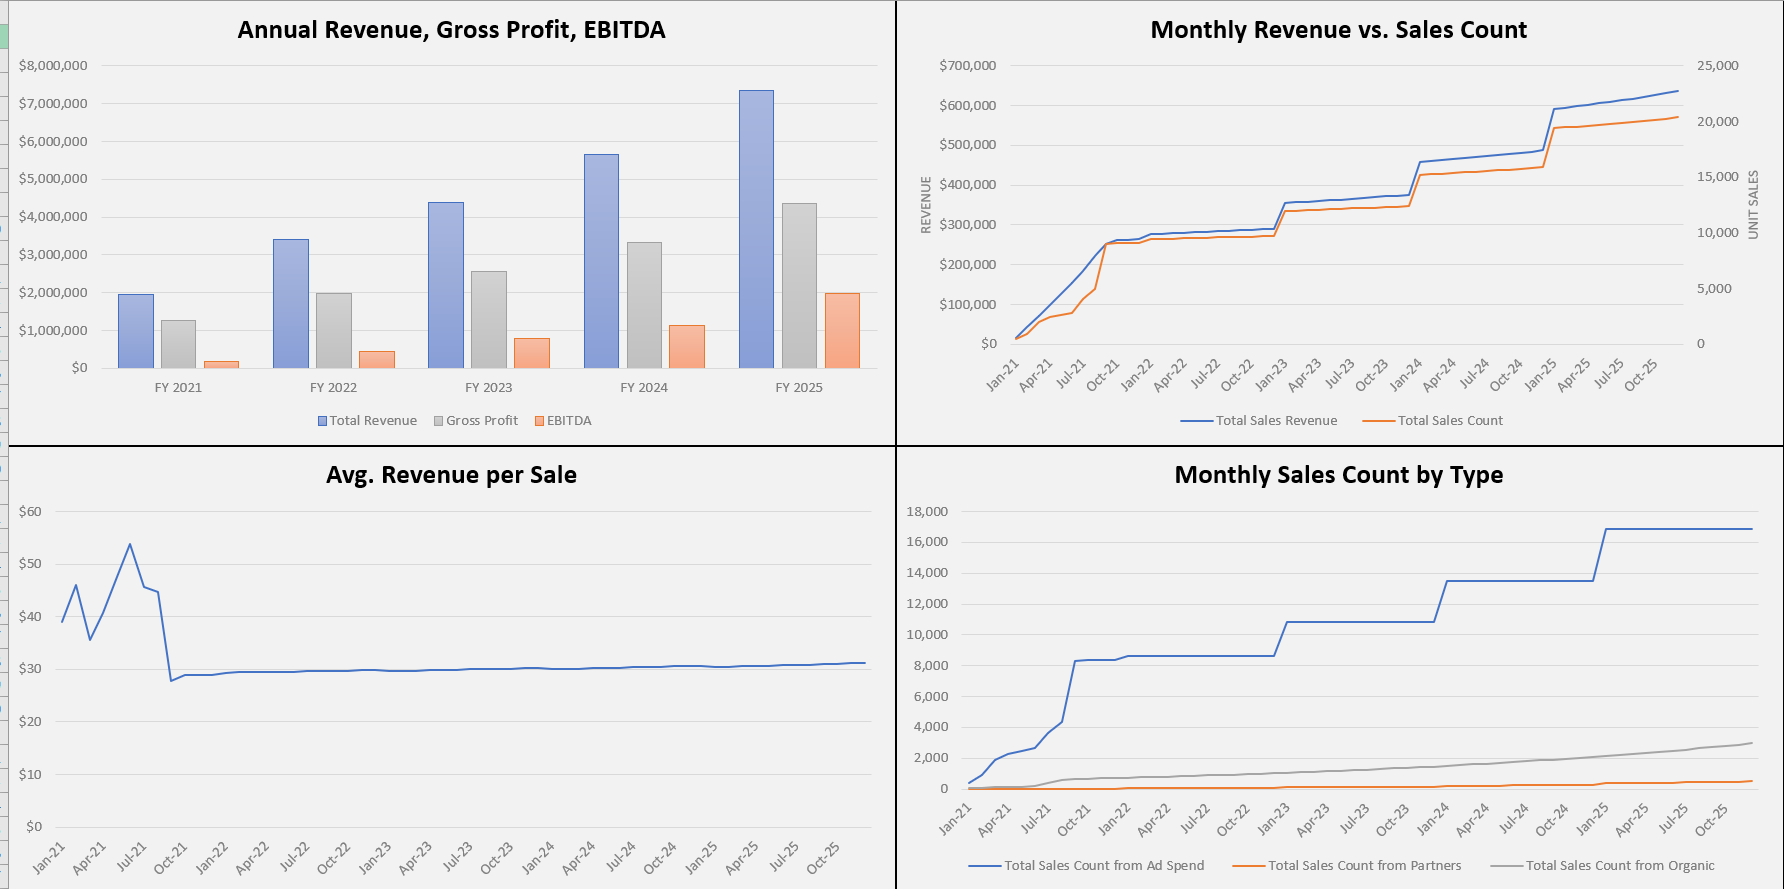
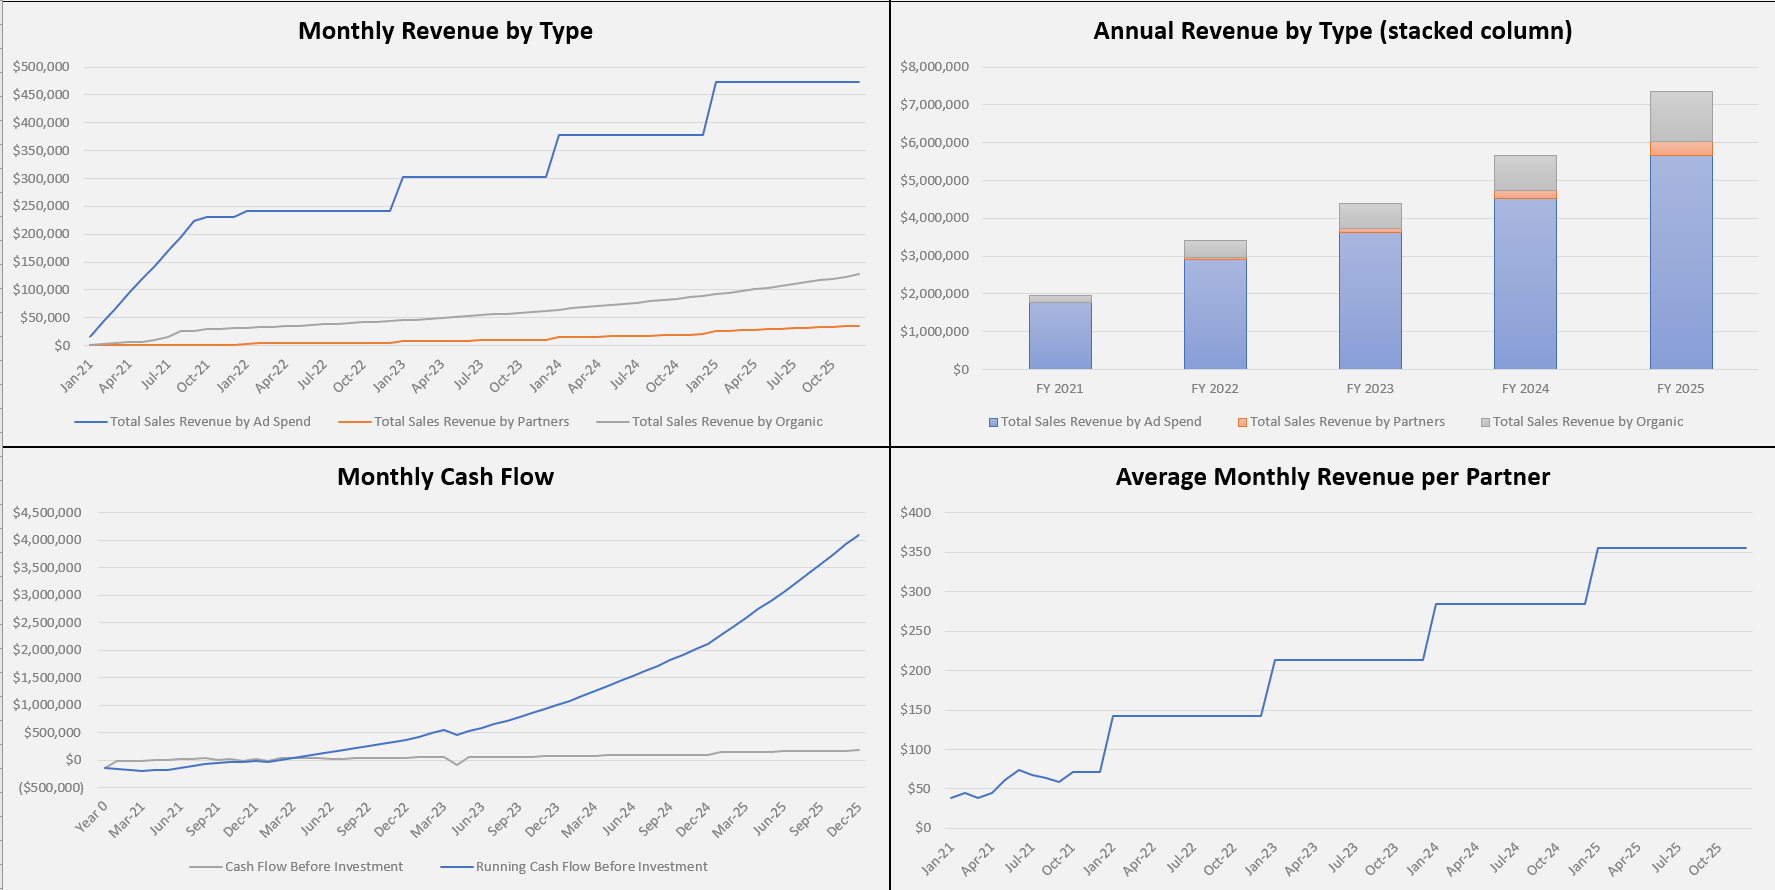
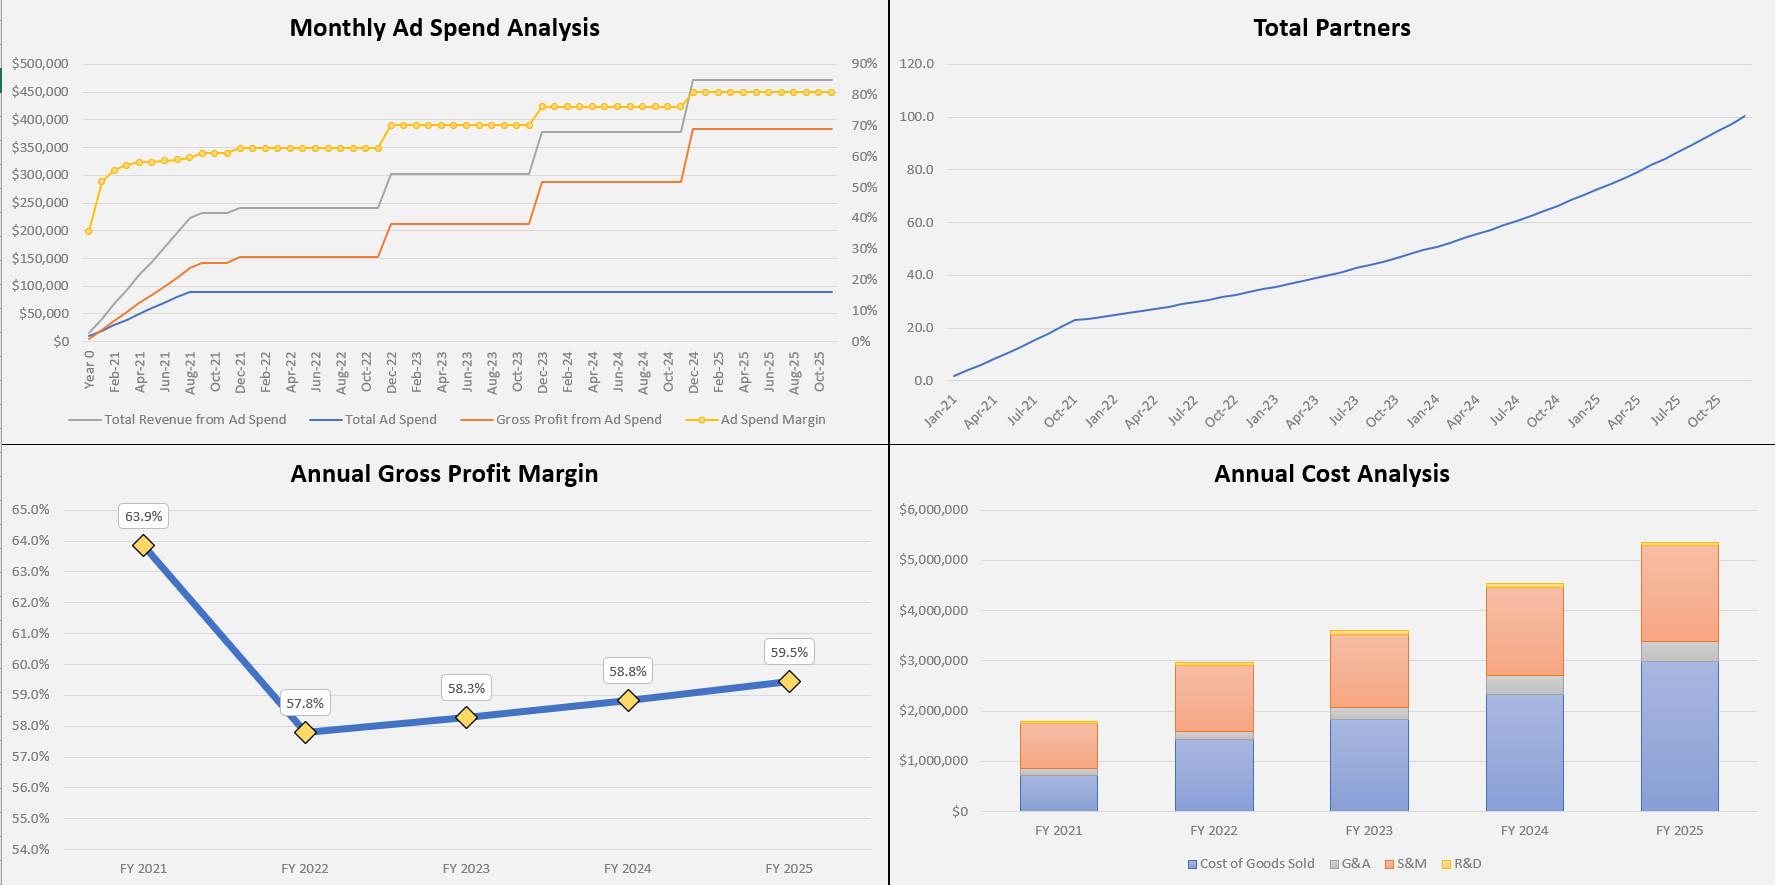
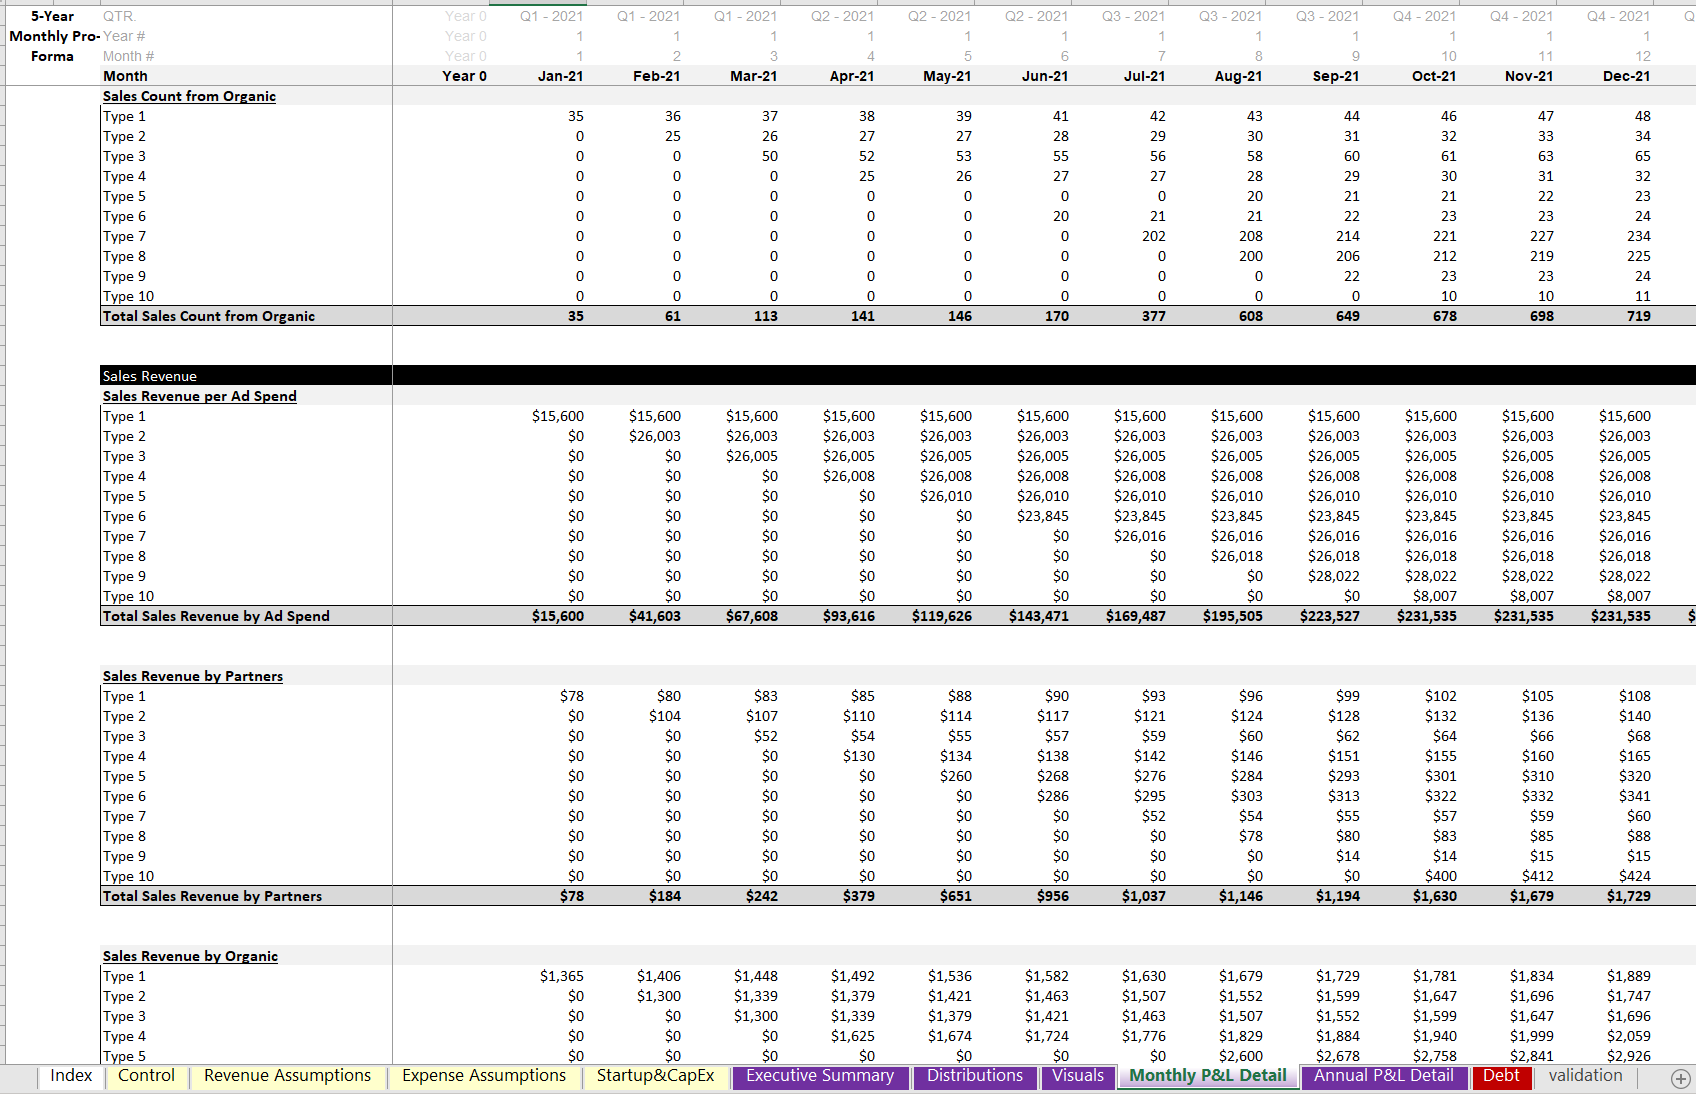
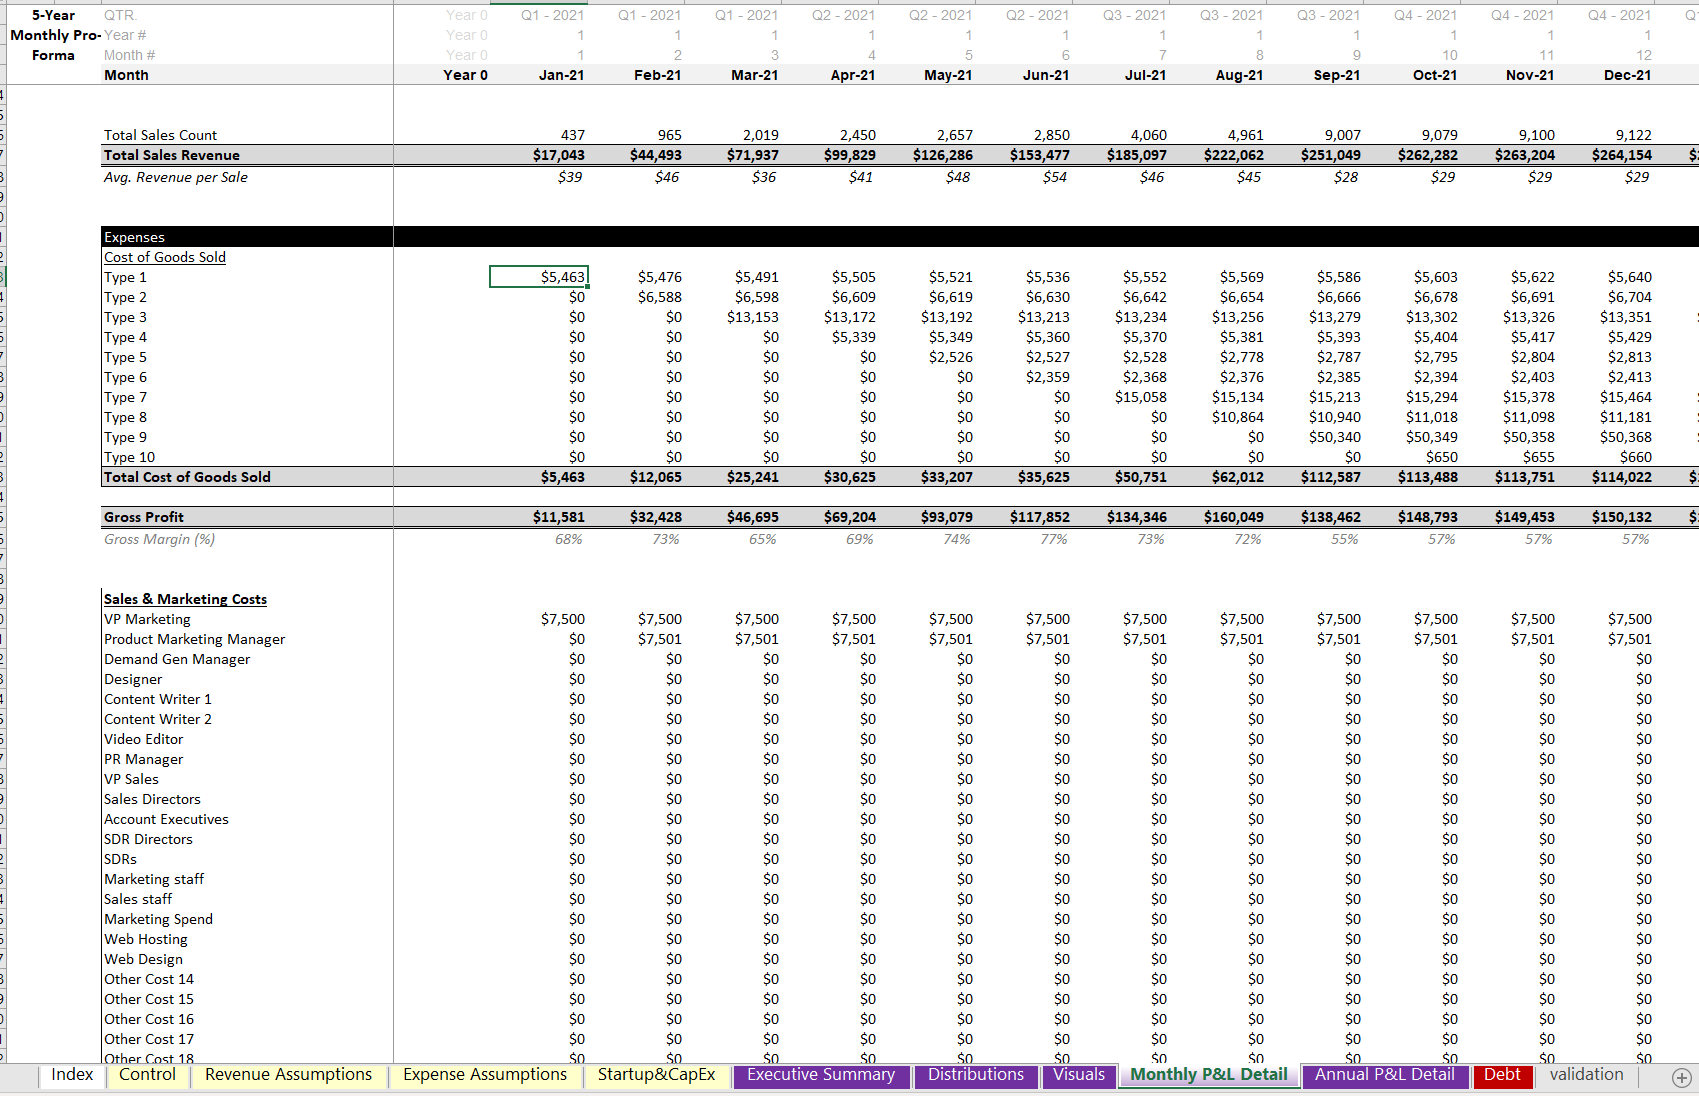
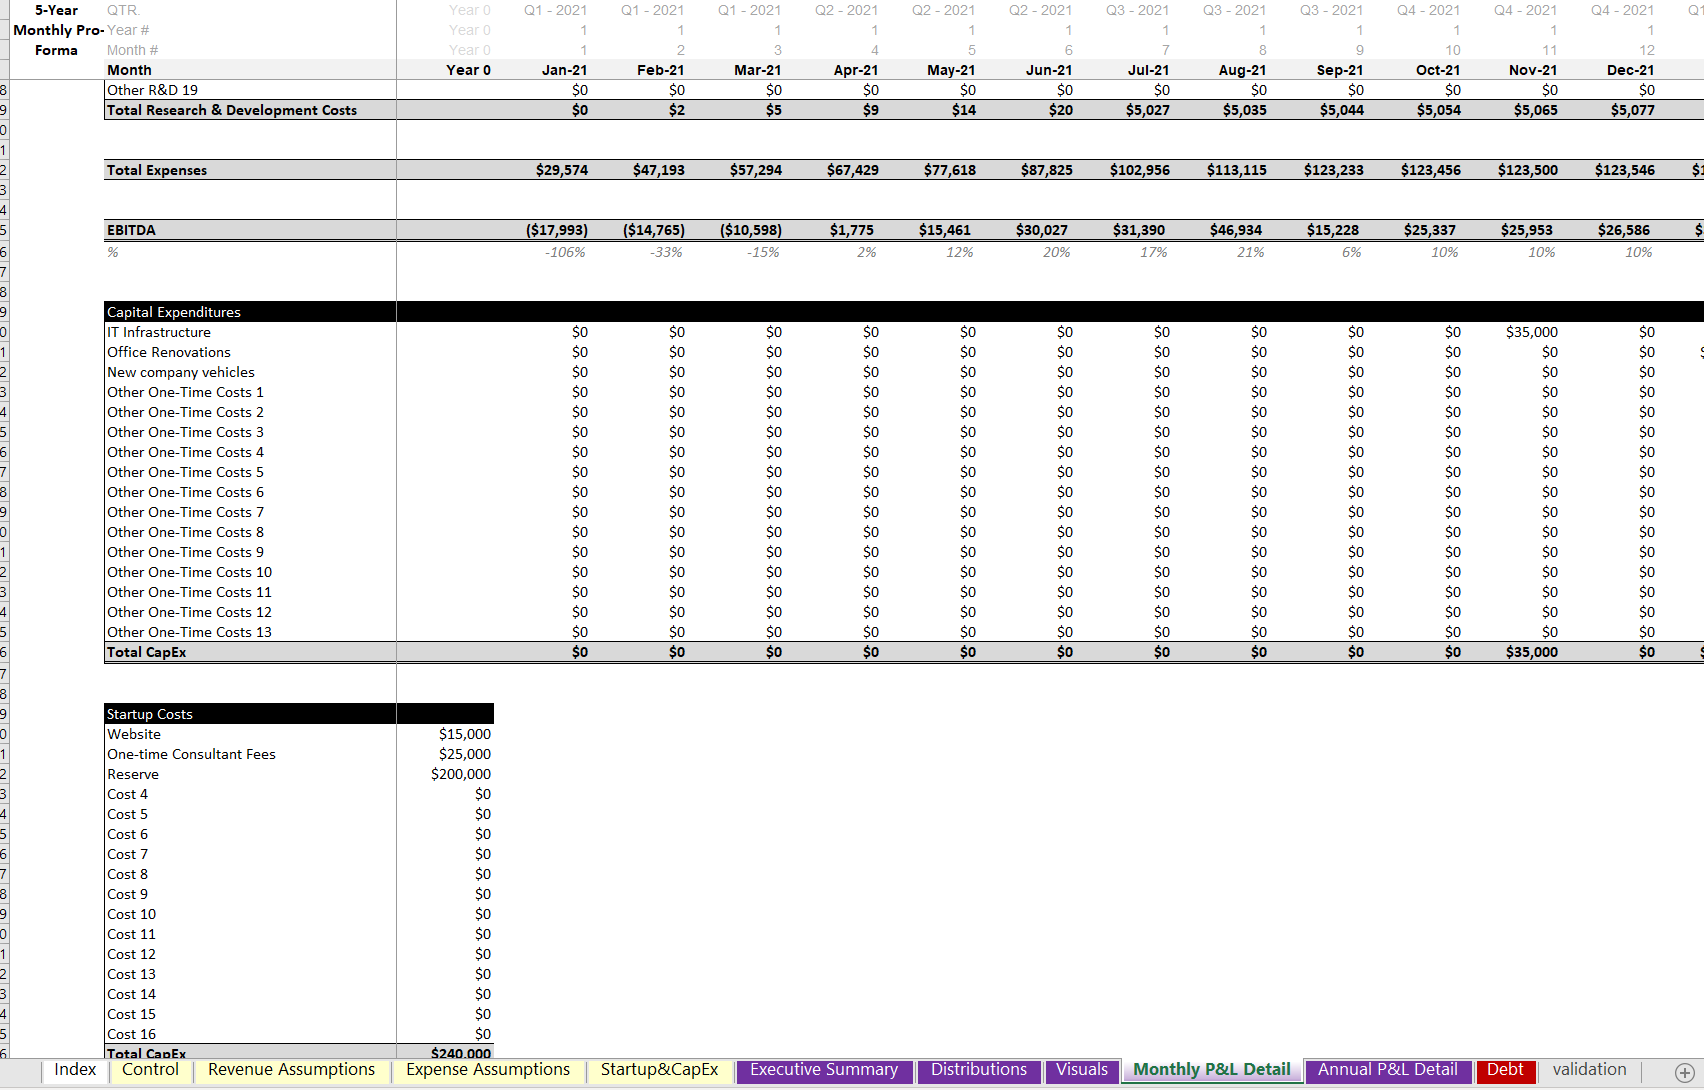
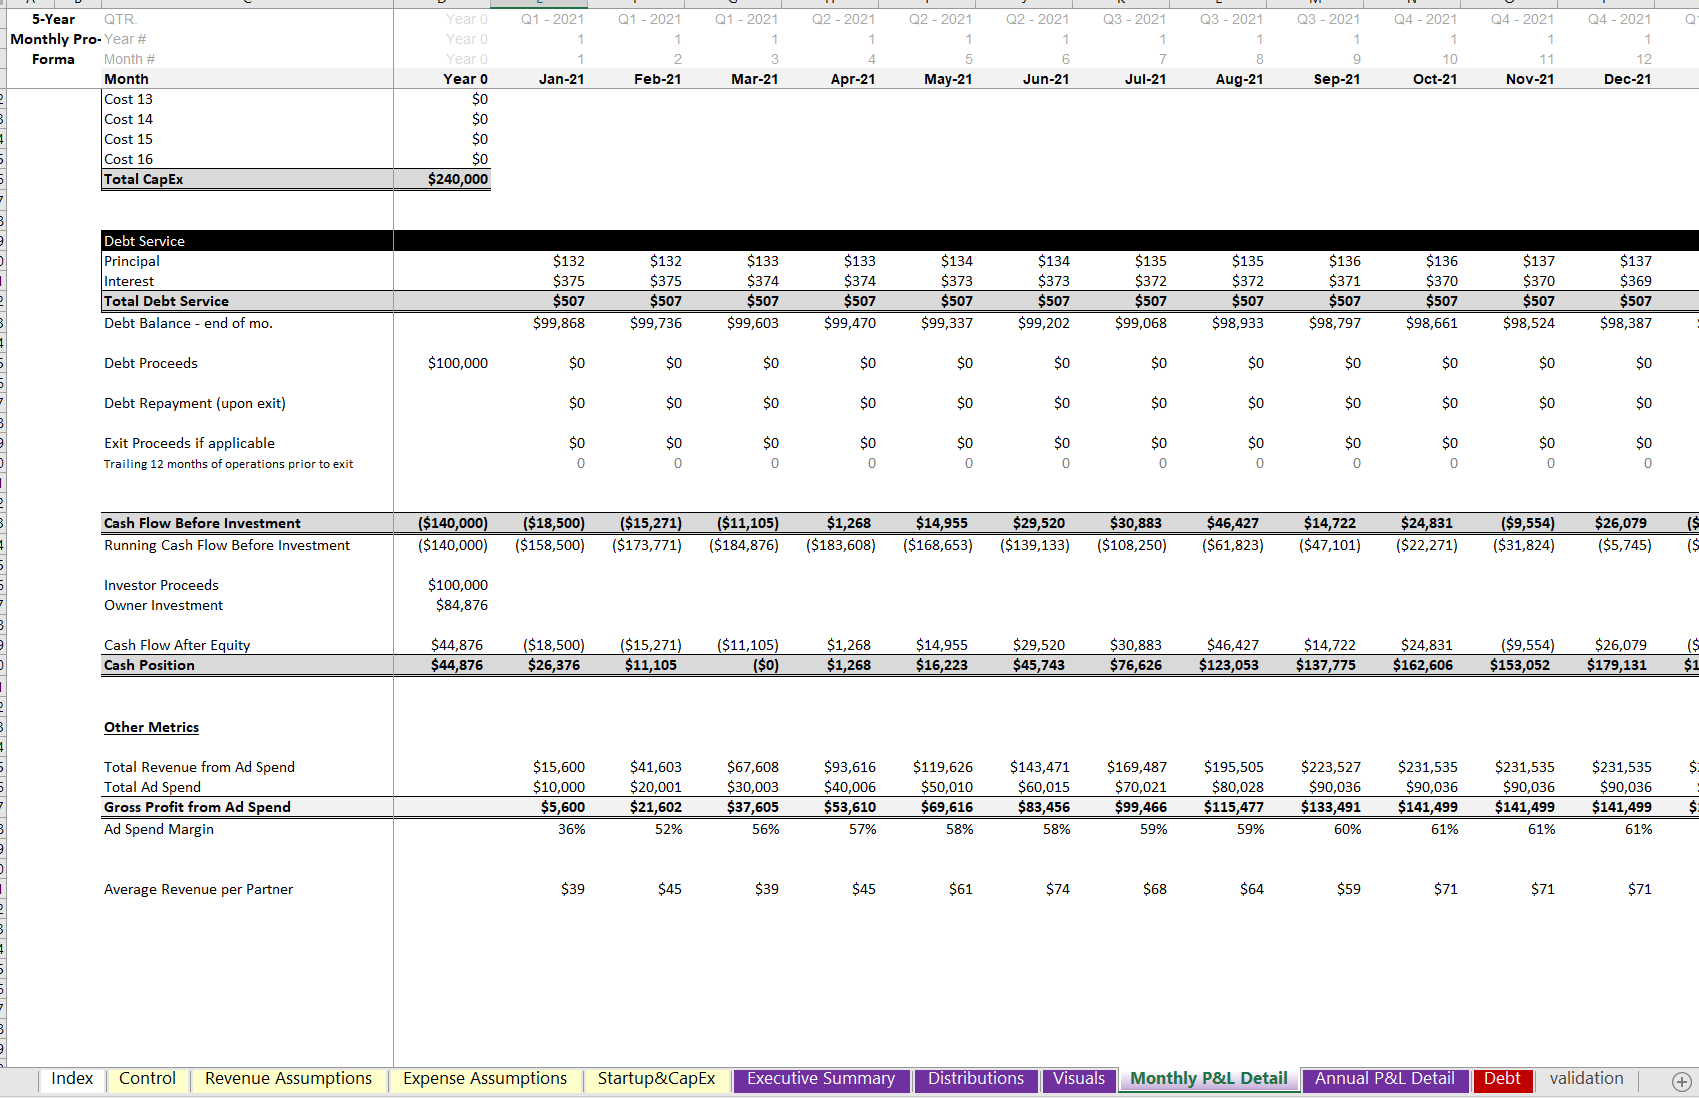
General eCommerce 5-Year Startup Financial Model: 3 Revenue Drivers

Type of Business :

Financial Models

Price : USD 75 75.00

Need More Clarifications/Customized Tool? Generate Ticket

Add to Wishlist icrest approved product

  • Short Description

    This is a general eCommerce financial model for startups that will provide up to a 5-year monthly and annual forecast that is driven off a wide range of dynamic assumptions. Up to three sales channels were built to drive revenues.

  • Full Description

    eCommerce just means selling things online. It could be tangible goods or digital products or services of any kind. The user begins by entering the start year and general assumptions about funding sources and exit multiples. The nuts and bolts begin on the ‘Revenue Assumptions’ tab. This allows the user to drive eCommerce revenue based on up to 10 SKU’s or SKU categories. Each category has a defined average selling price and start month. Within each category, the user defines three main inputs (ad spend, partners, and organic). Ad spend driven revenue is based on average cost per sale via ad spend. The partner channel (i.e. affiliates or 3rd party partners that sell your eCommerce products for a share of the revenue) is based on starting partner count and average percentage growth of partners over each of the 5 years and average sales per month per partner. Finally, organic sales are based on a defined starting organic monthly sales count and percentage growth of organic sales over 5 years. The next tab is for operating expenses and cost of goods sold. Here the user defines the partner commission rate by category type and cost of goods sold per category if applicable. There are separate schedules for startup costs and capex. After all the assumption tabs are filled out, a monthly and annual Profit / Loss detail will populate as well as a high level Executive Summary of key financial metrics and the project level cash contribution and distribution results. If investor equity was a funding source, there will be a DCF Analysis and general cash flow summary for them as well as for owners. This includes equity multiple and IRR / ROI. Lots of visualizations were put in to make it easy to see how the assumptions impact expected performance.

  • Table of Content
    No. Content
    Index Tab Explanation of each tab.
  • Reviews

    No Review. Write a review and be the first.

Related Products