Sign Up, Its Free

Join our Affiliate Program by simply copying the link of our products on your site and earn affiliate commission on every sale

Are you a Marketing expert, having some strategic tools? Come and Join as our Vendor

If you are a Vendor looking to sell tools in any specific category which is not present at the moment on our platform, for instance, say "Branding and Strategy." Simply, email us along with one of your sample business tools on "[email protected]" and we will add the same after verifying.

We have our showcased inventory as well so that the upcoming vendors can view the quality of business tools we are looking for.

What's New

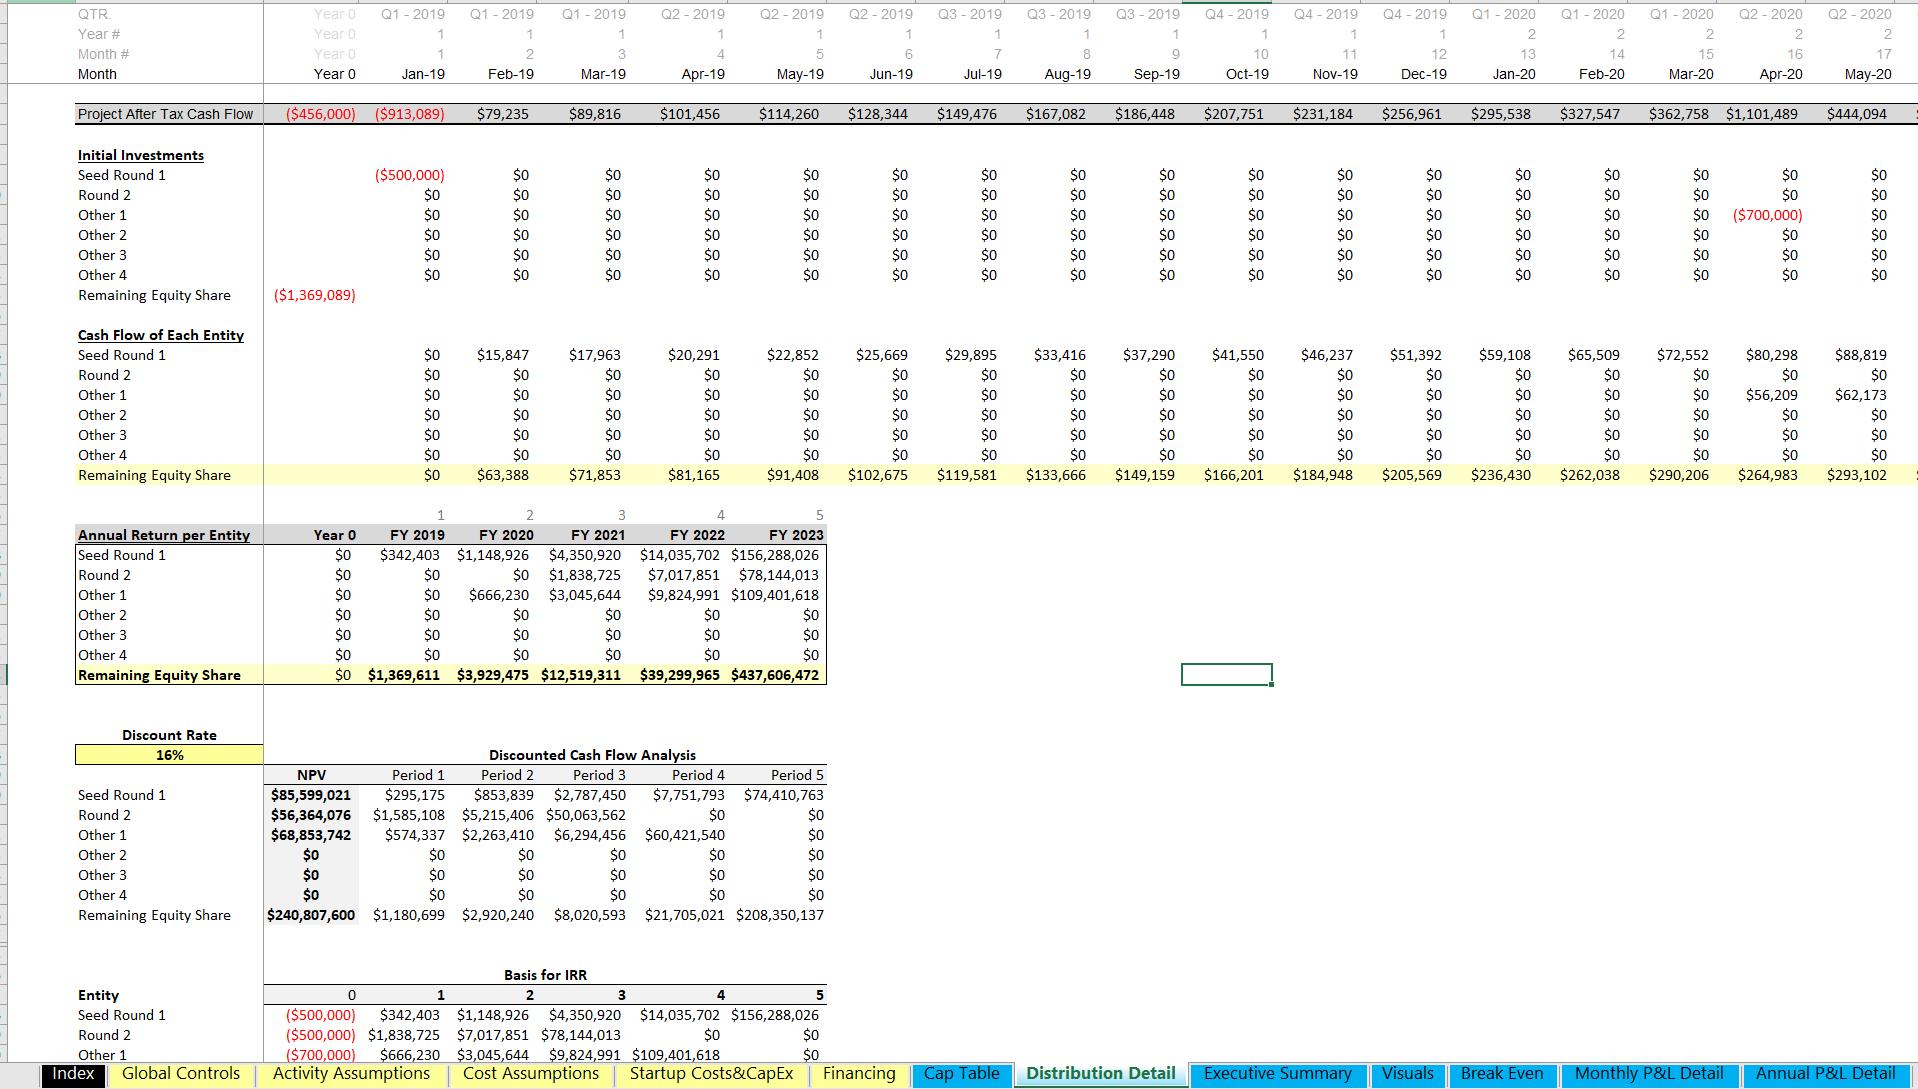
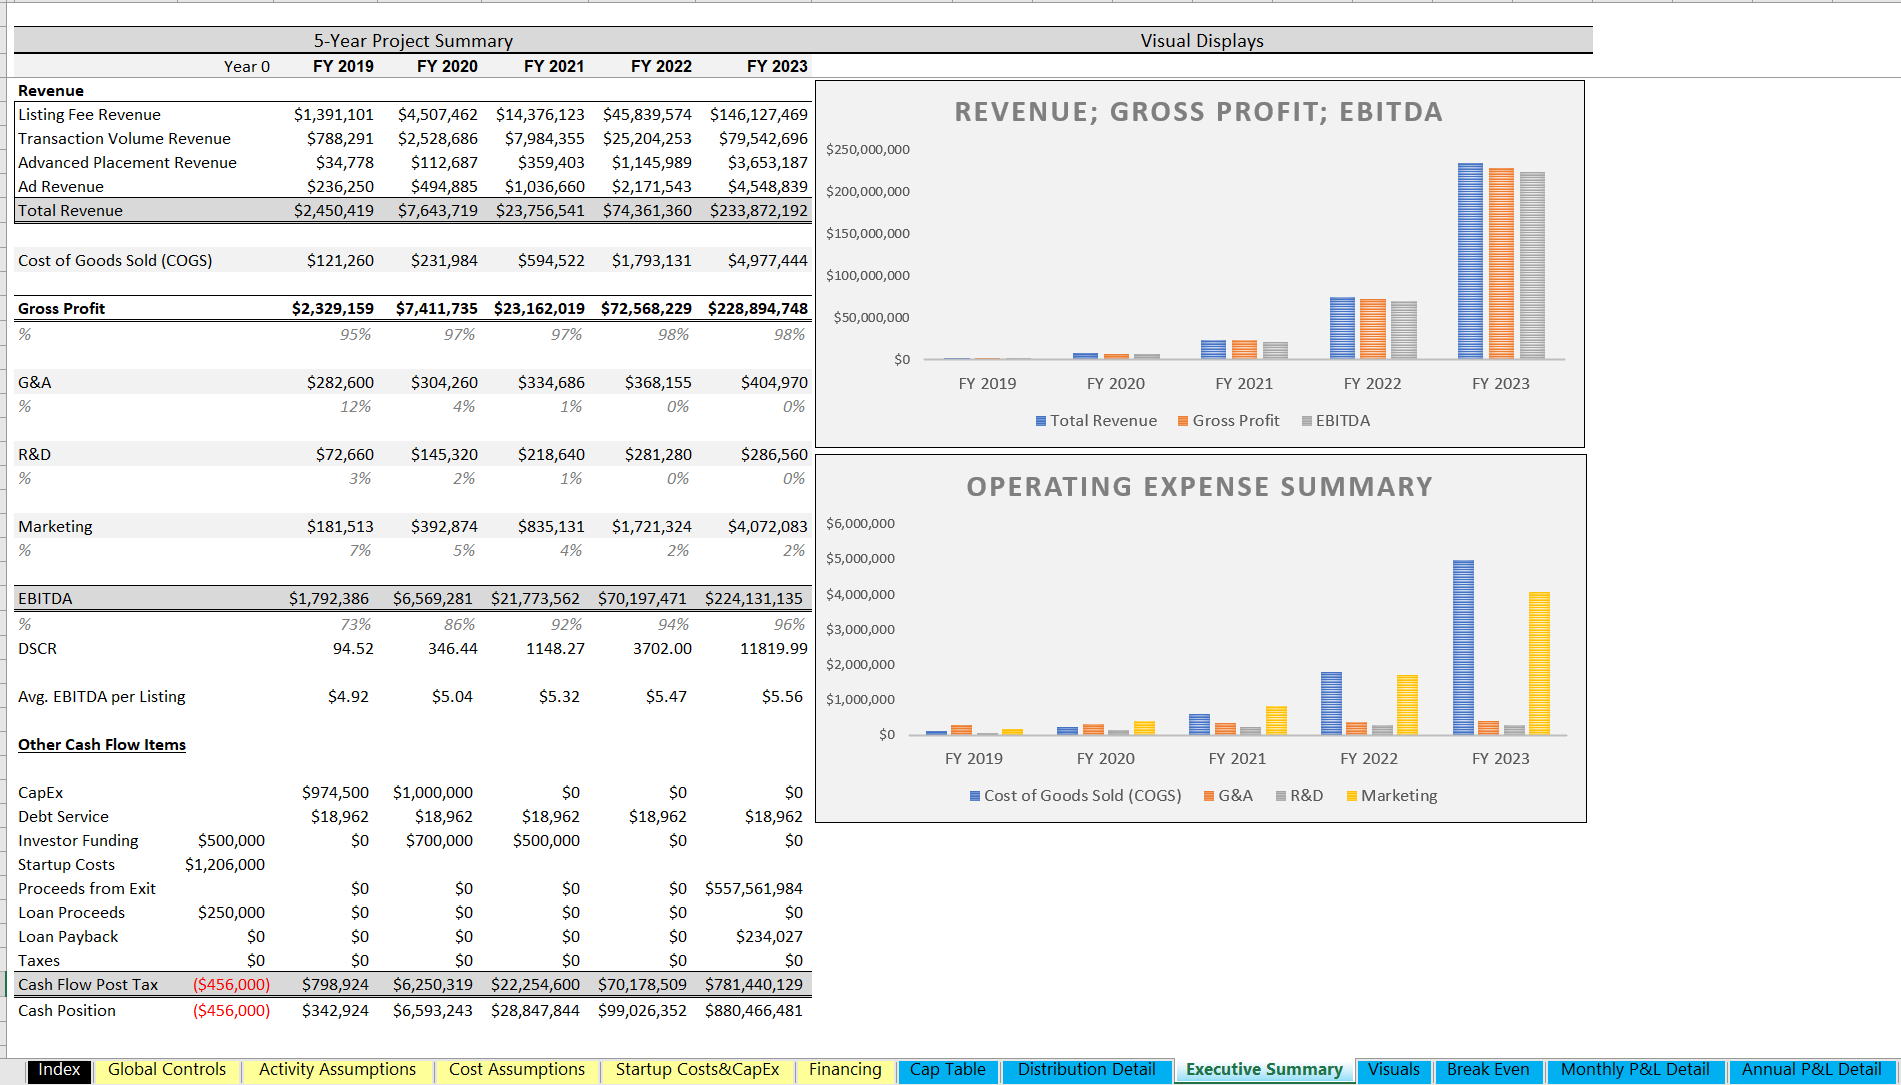
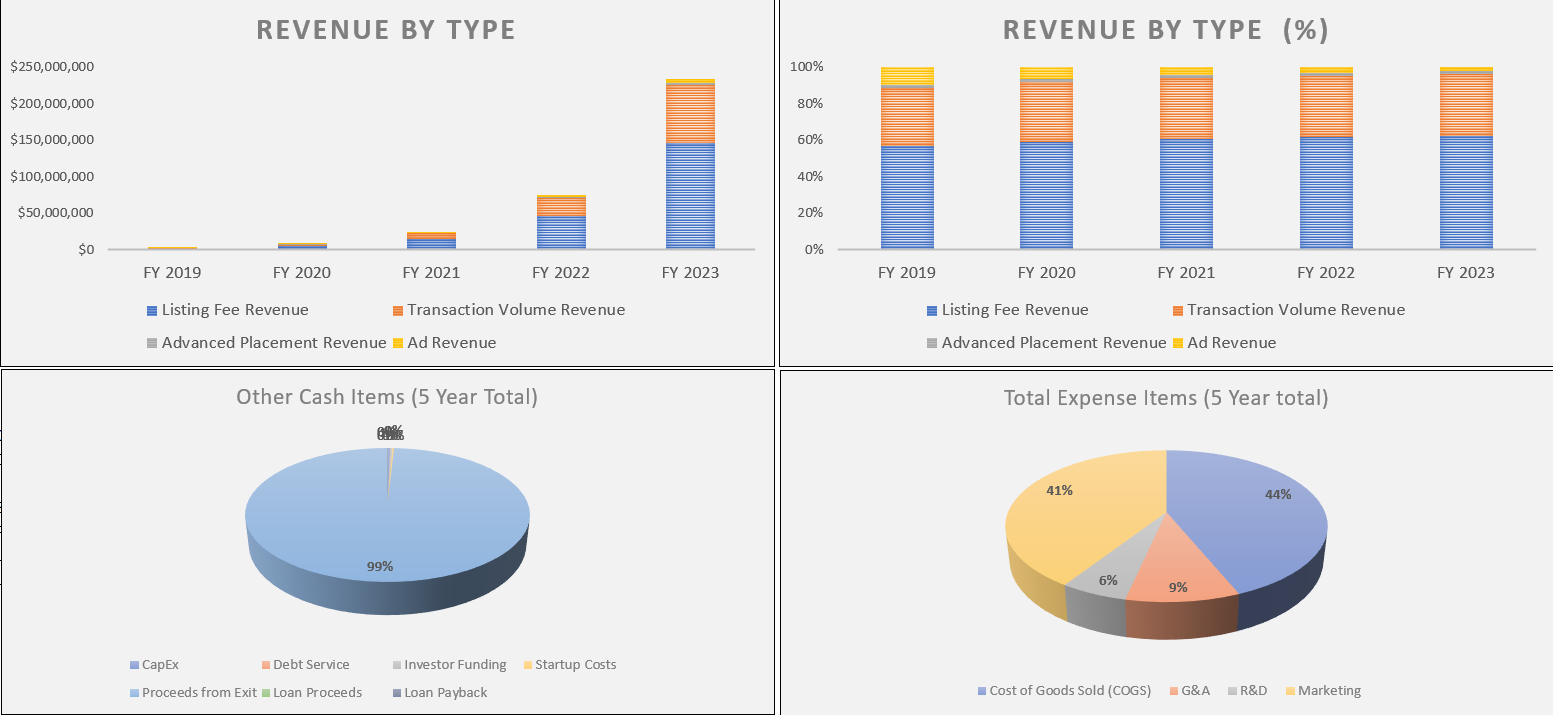
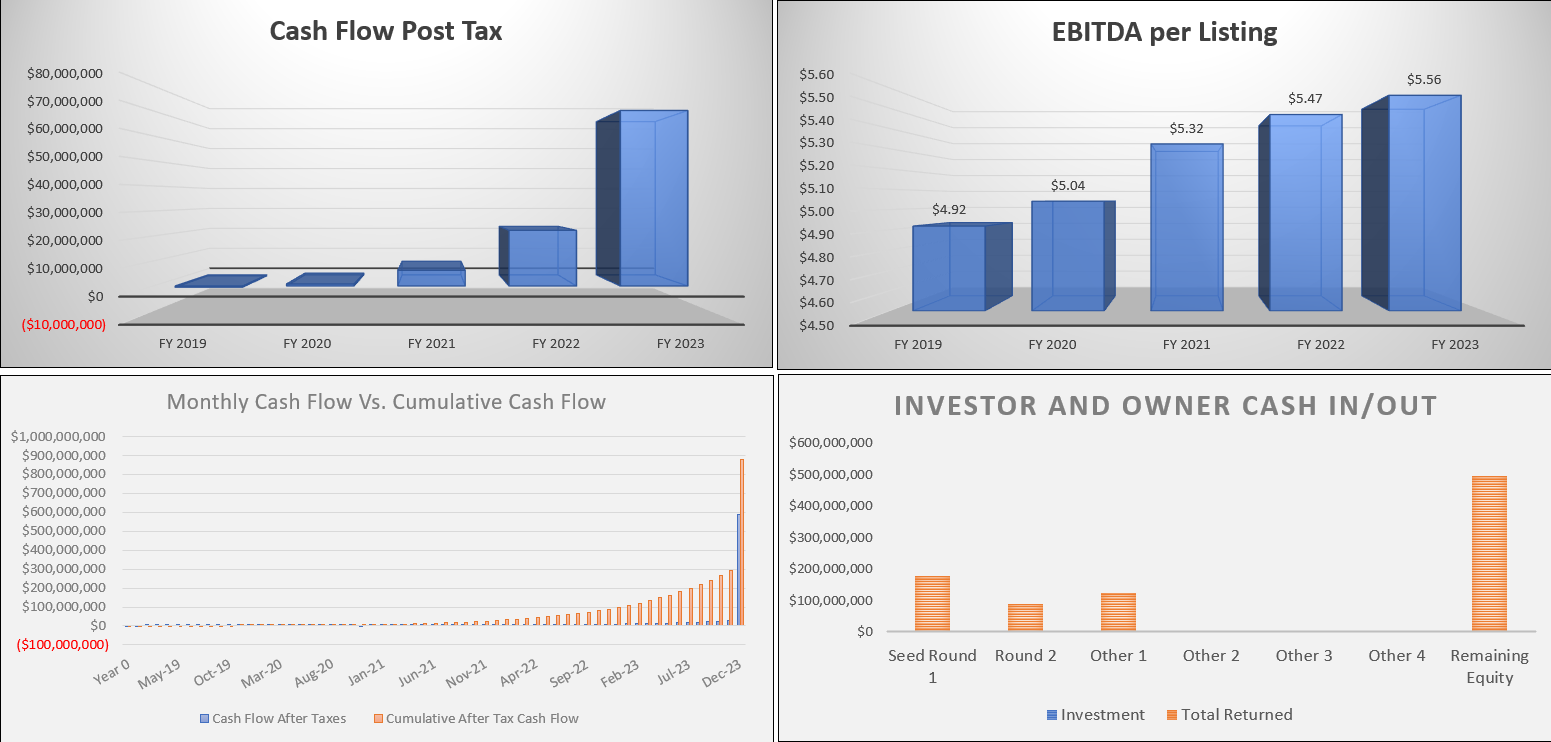
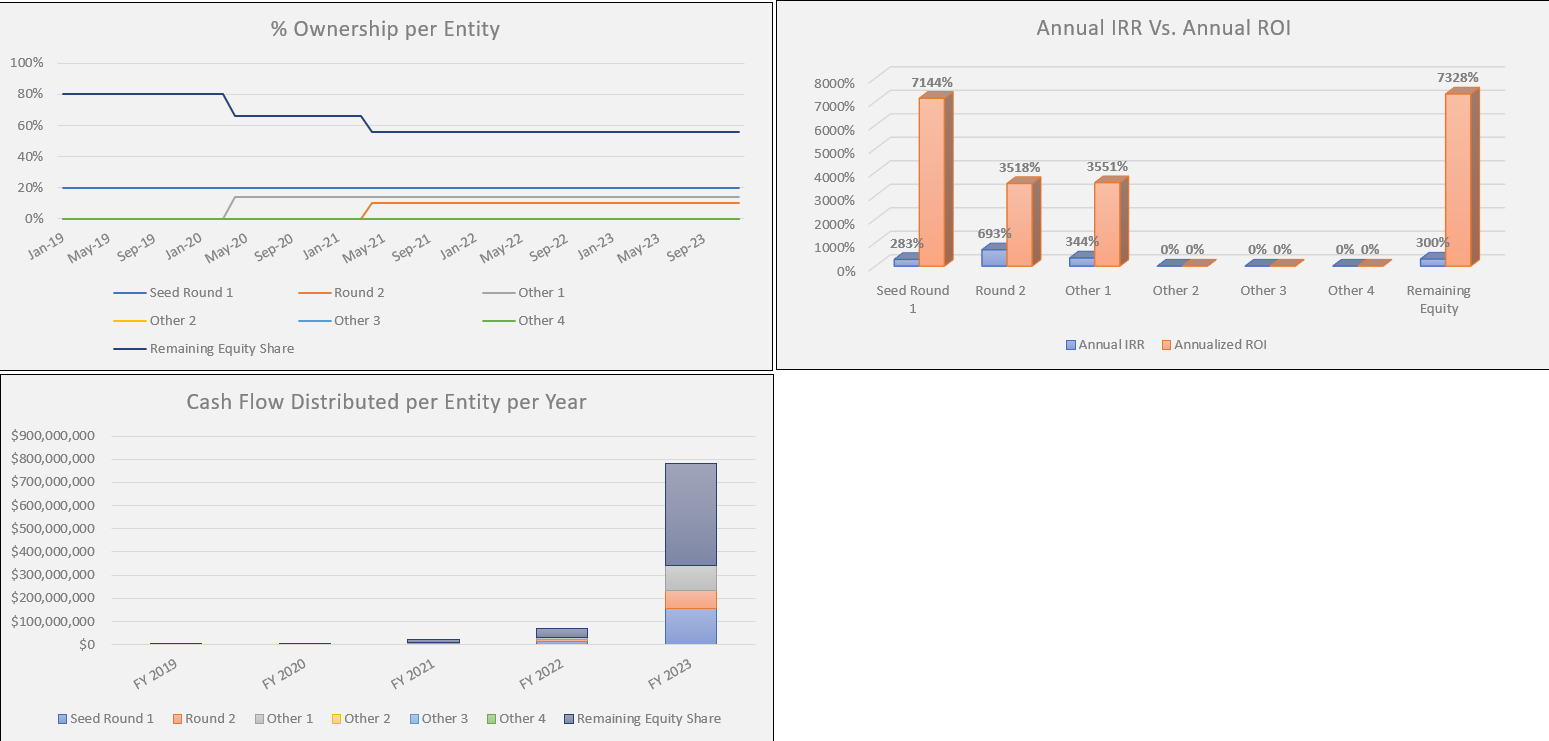
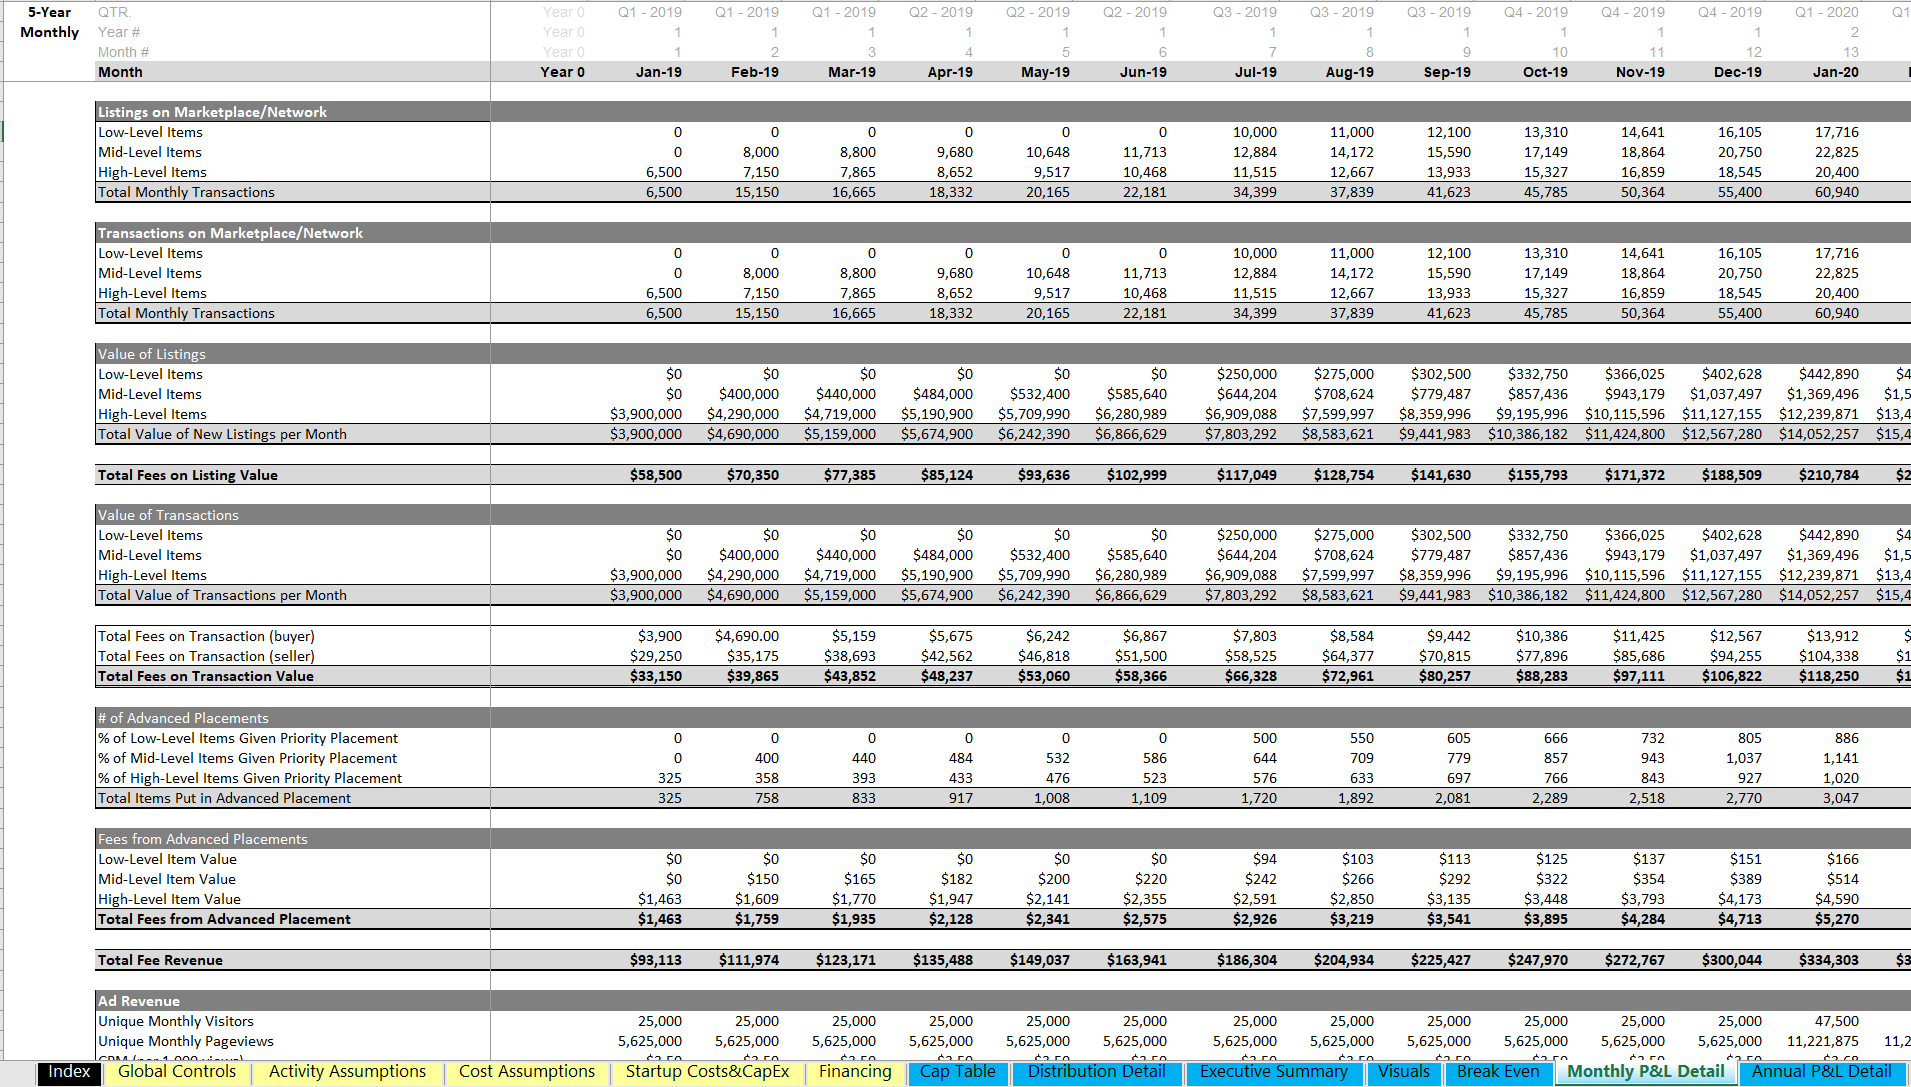
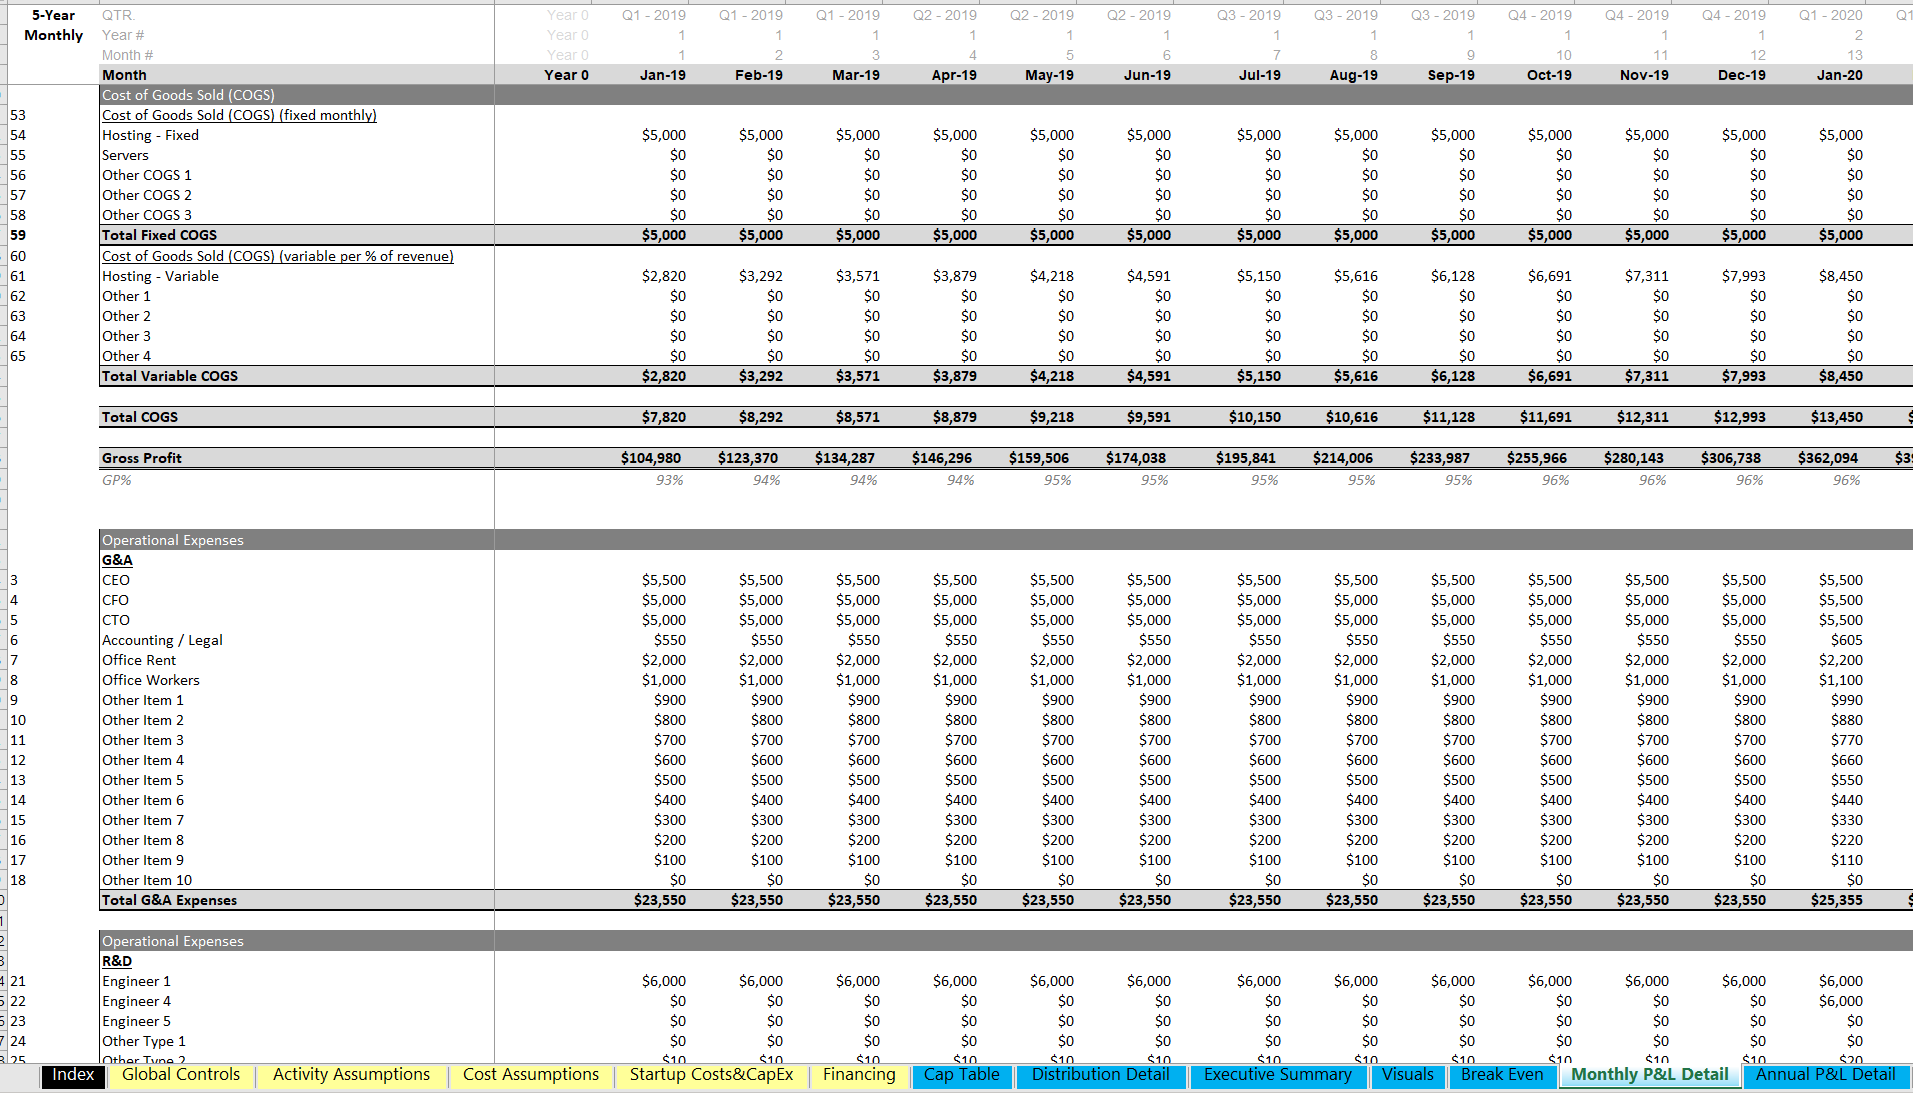
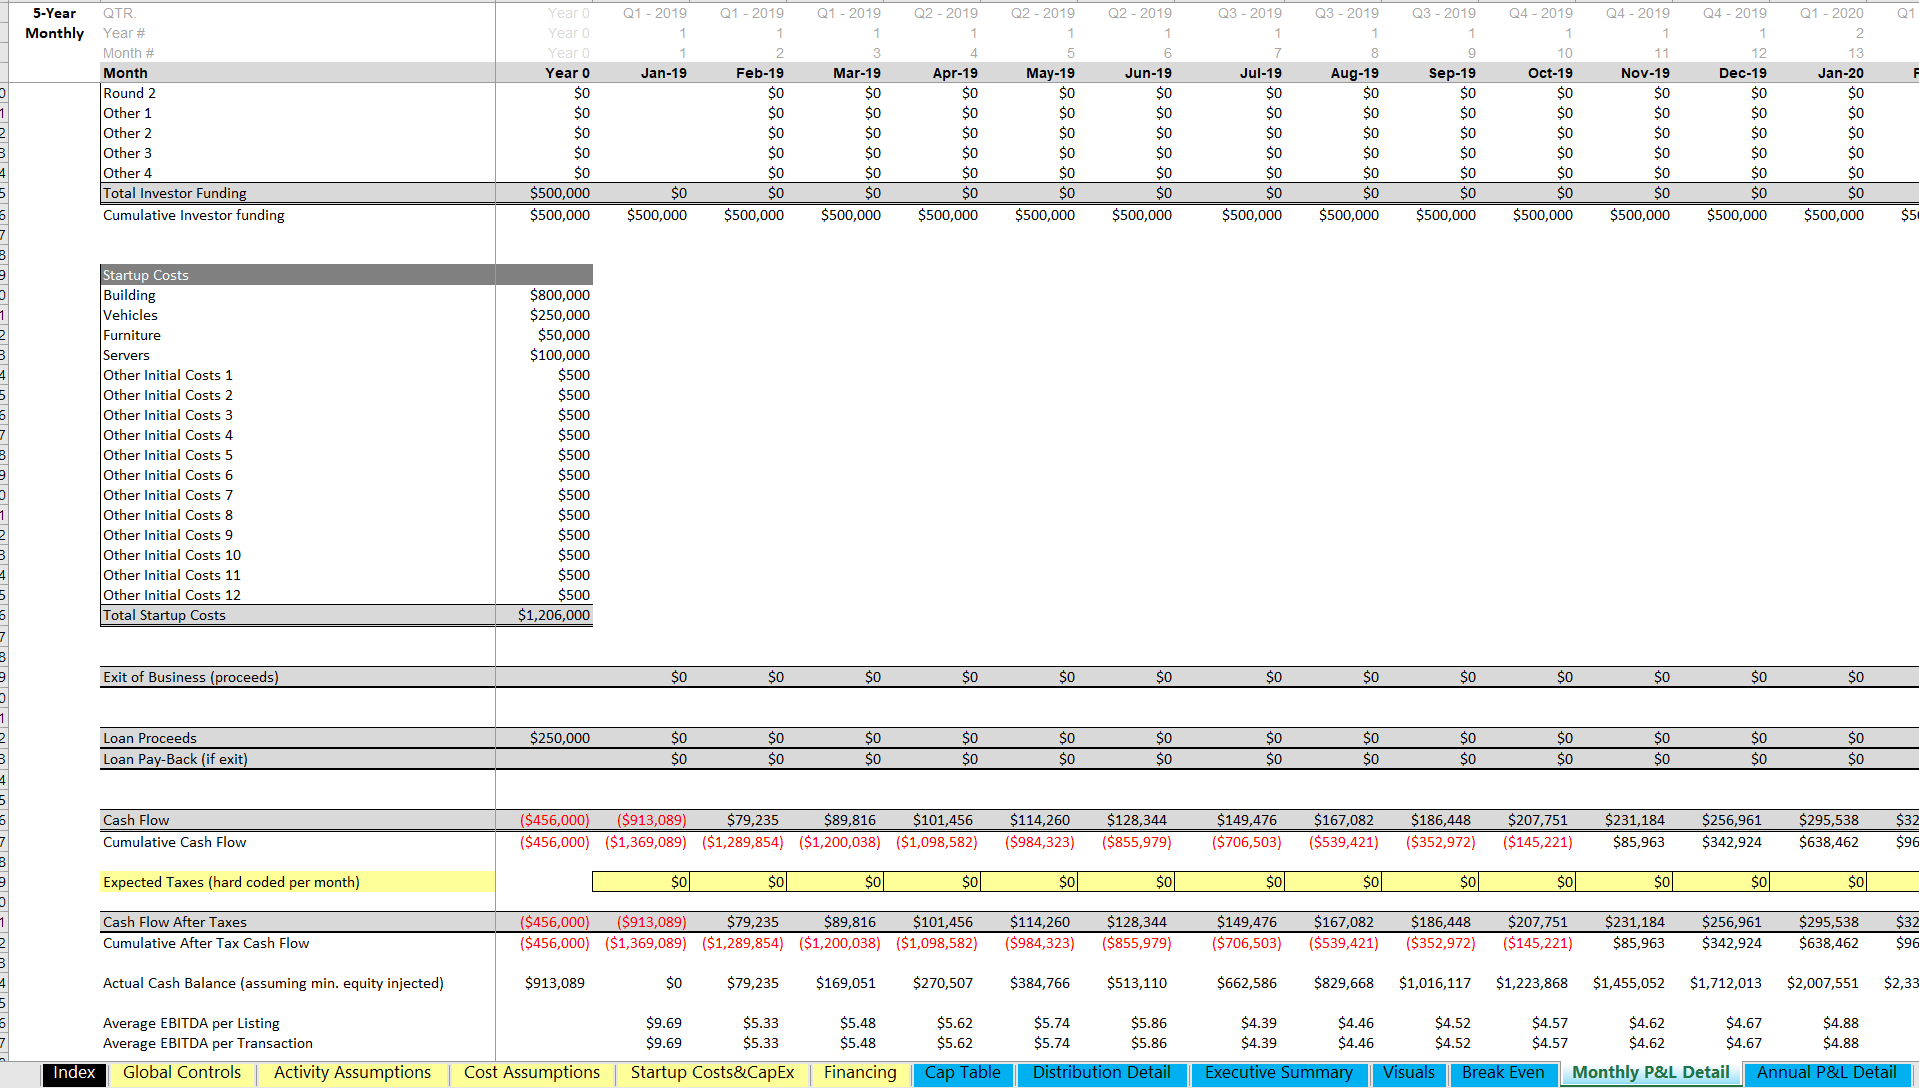
Listing Marketplace or Network 5-Year Startup Financial Model

Type of Business :

Financial Models

Price : USD 75 75.00

Need More Clarifications/Customized Tool? Generate Ticket

Add to Wishlist icrest approved product

  • Short Description

    A startup 5-year monthly and annual financial model for a network / marketplace. Includes a cap table with percentage distributions over time. Revenue is driven primarily be 3 listing types that all have their own configurable attributes.

  • Full Description

    The model focuses on the most basic elements of a network/marketplace in order to be usable for a broad range of use cases. The user will start by entering global assumptions about the start year, exit month (if applicable), exit multiple, funding sources, and any debt sources. The nuts and bolts are in the ‘Activity Assumptions’ tab and include the following fields across 5 years: # of Units Listed per Month by Year (three tiers each with their own % monthly growth in transaction volume, value per unit by year for all three tiers, network fee charged per transaction (to buyers) and its % change per year, network fee charged per transaction (to seller) and its % change per year, % of items listed that actually transact, standard listing fee for sellers (% of price), advanced placement (sellers paying more to rank higher in the organic results) and the % of low/mid/high level items given priority placement, average % increase from listing fee for priority placement, ad revenue based on expected unique monthly network visitors, their pageviews per month, and an average CPM that can change each year. Operating cost assumptions are populated in their own schedule based on start month and cost per month in each year. Startup and capex are also populated in their own schedules. A resulting monthly and annual financial summary will populate that drives down to EBITDA and cash flow. A break-even analysis was also built for the project level. The cap table shows total cash returned to each entity/owner as well as their IRR, total cash returned, and total ROI. Finally, there is a visuals tab to display key metrics of the forecast as well as a high level executive summary of the project that displays revenues, COGS, opex, EBITDA, all cash flow items, and final cash flow along with its own visual.

  • Table of Content
    No. Content
    Index Tab Shows each tab and the description therein.
  • Reviews

    No Review. Write a review and be the first.

Related Products