Sign Up, Its Free

Join our Affiliate Program by simply copying the link of our products on your site and earn affiliate commission on every sale

Are you a Marketing expert, having some strategic tools? Come and Join as our Vendor

If you are a Vendor looking to sell tools in any specific category which is not present at the moment on our platform, for instance, say "Branding and Strategy." Simply, email us along with one of your sample business tools on "[email protected]" and we will add the same after verifying.

We have our showcased inventory as well so that the upcoming vendors can view the quality of business tools we are looking for.

What's New

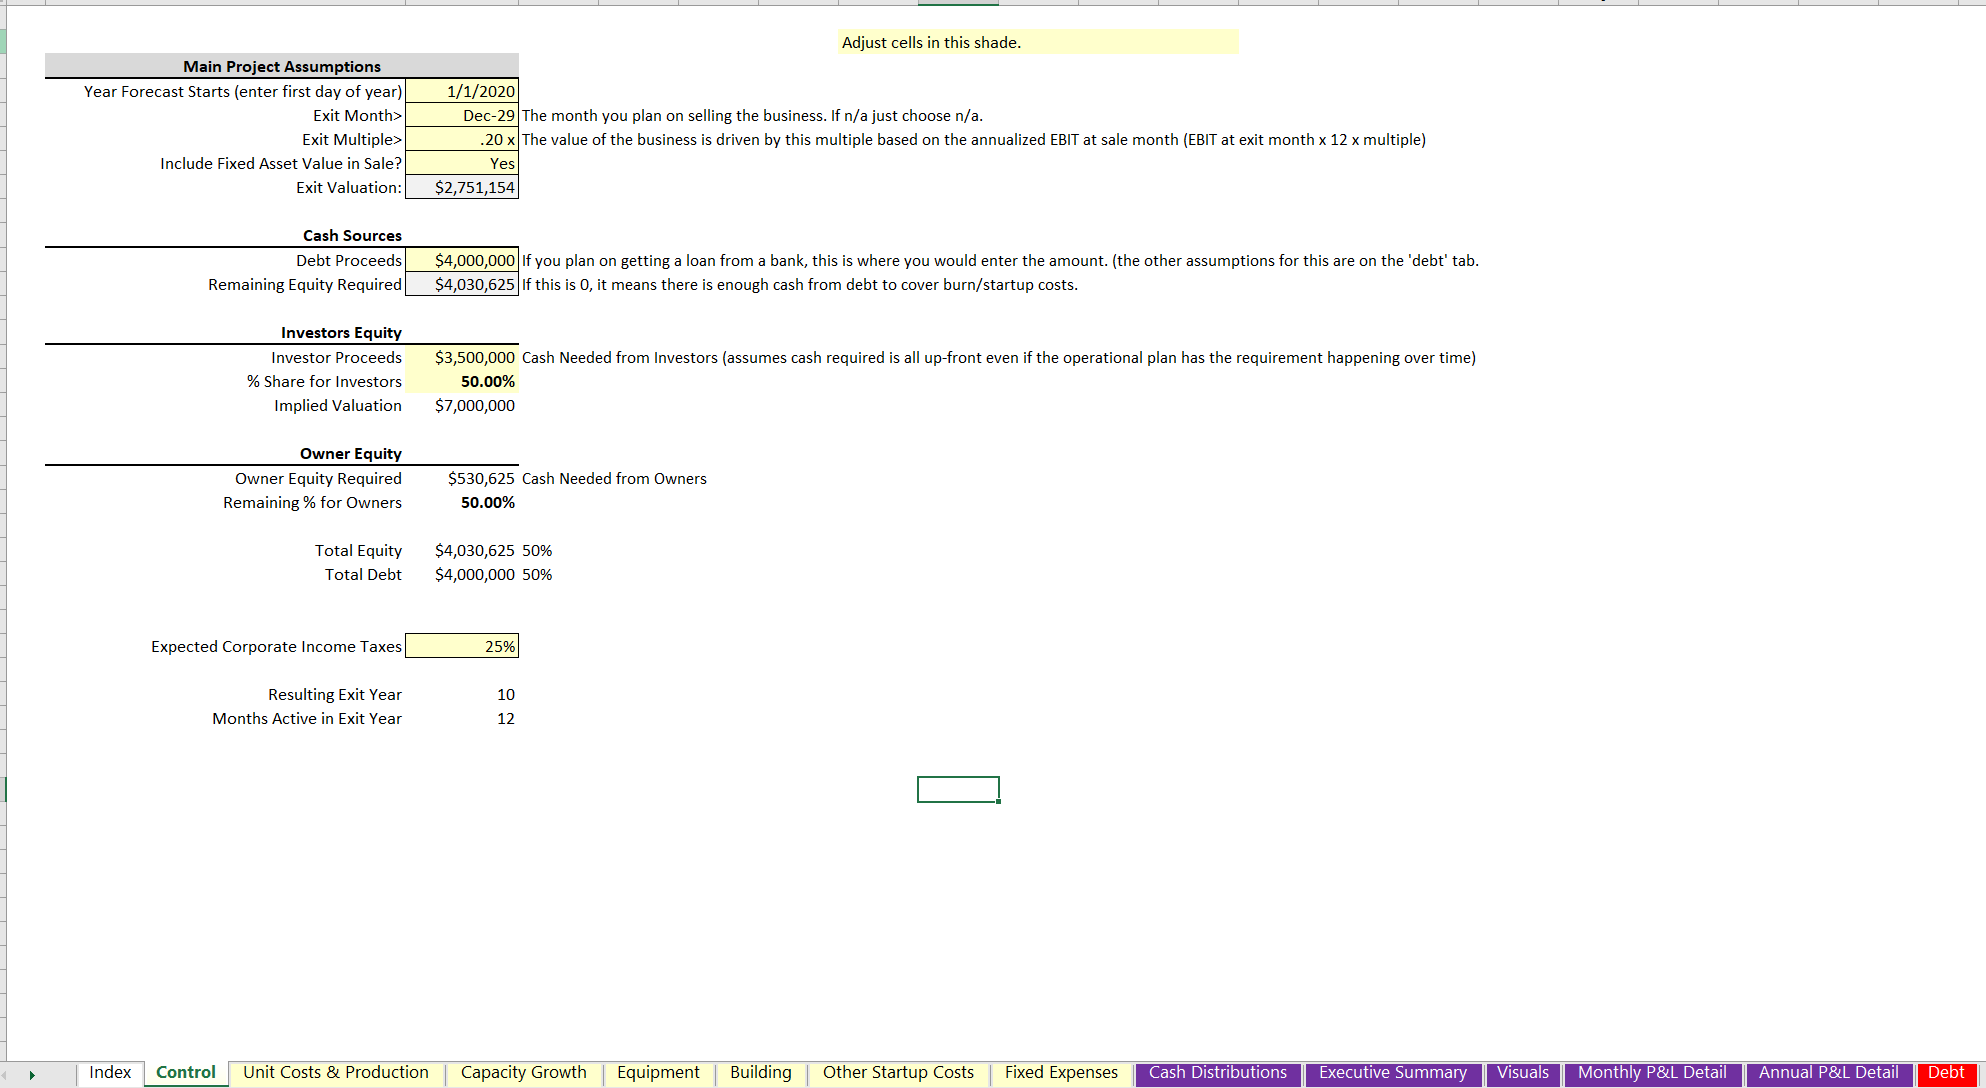
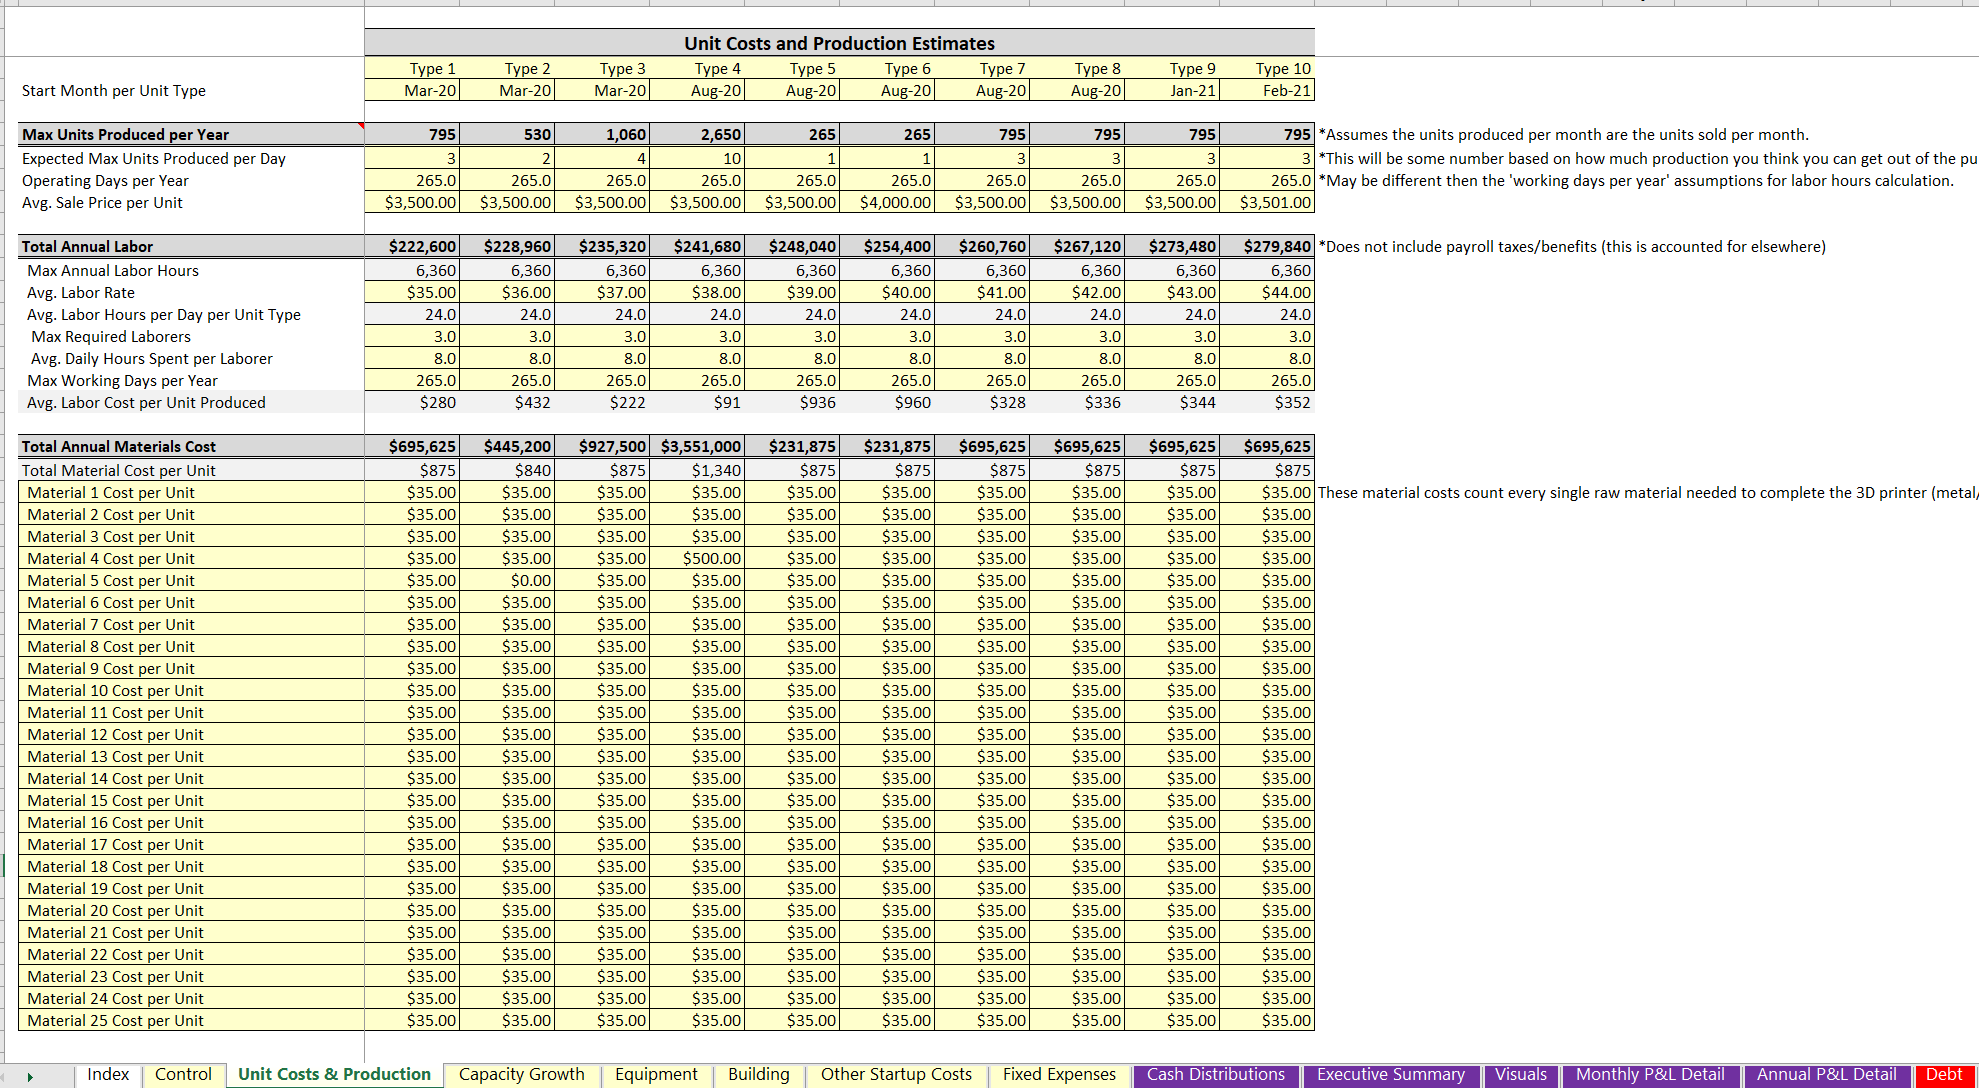
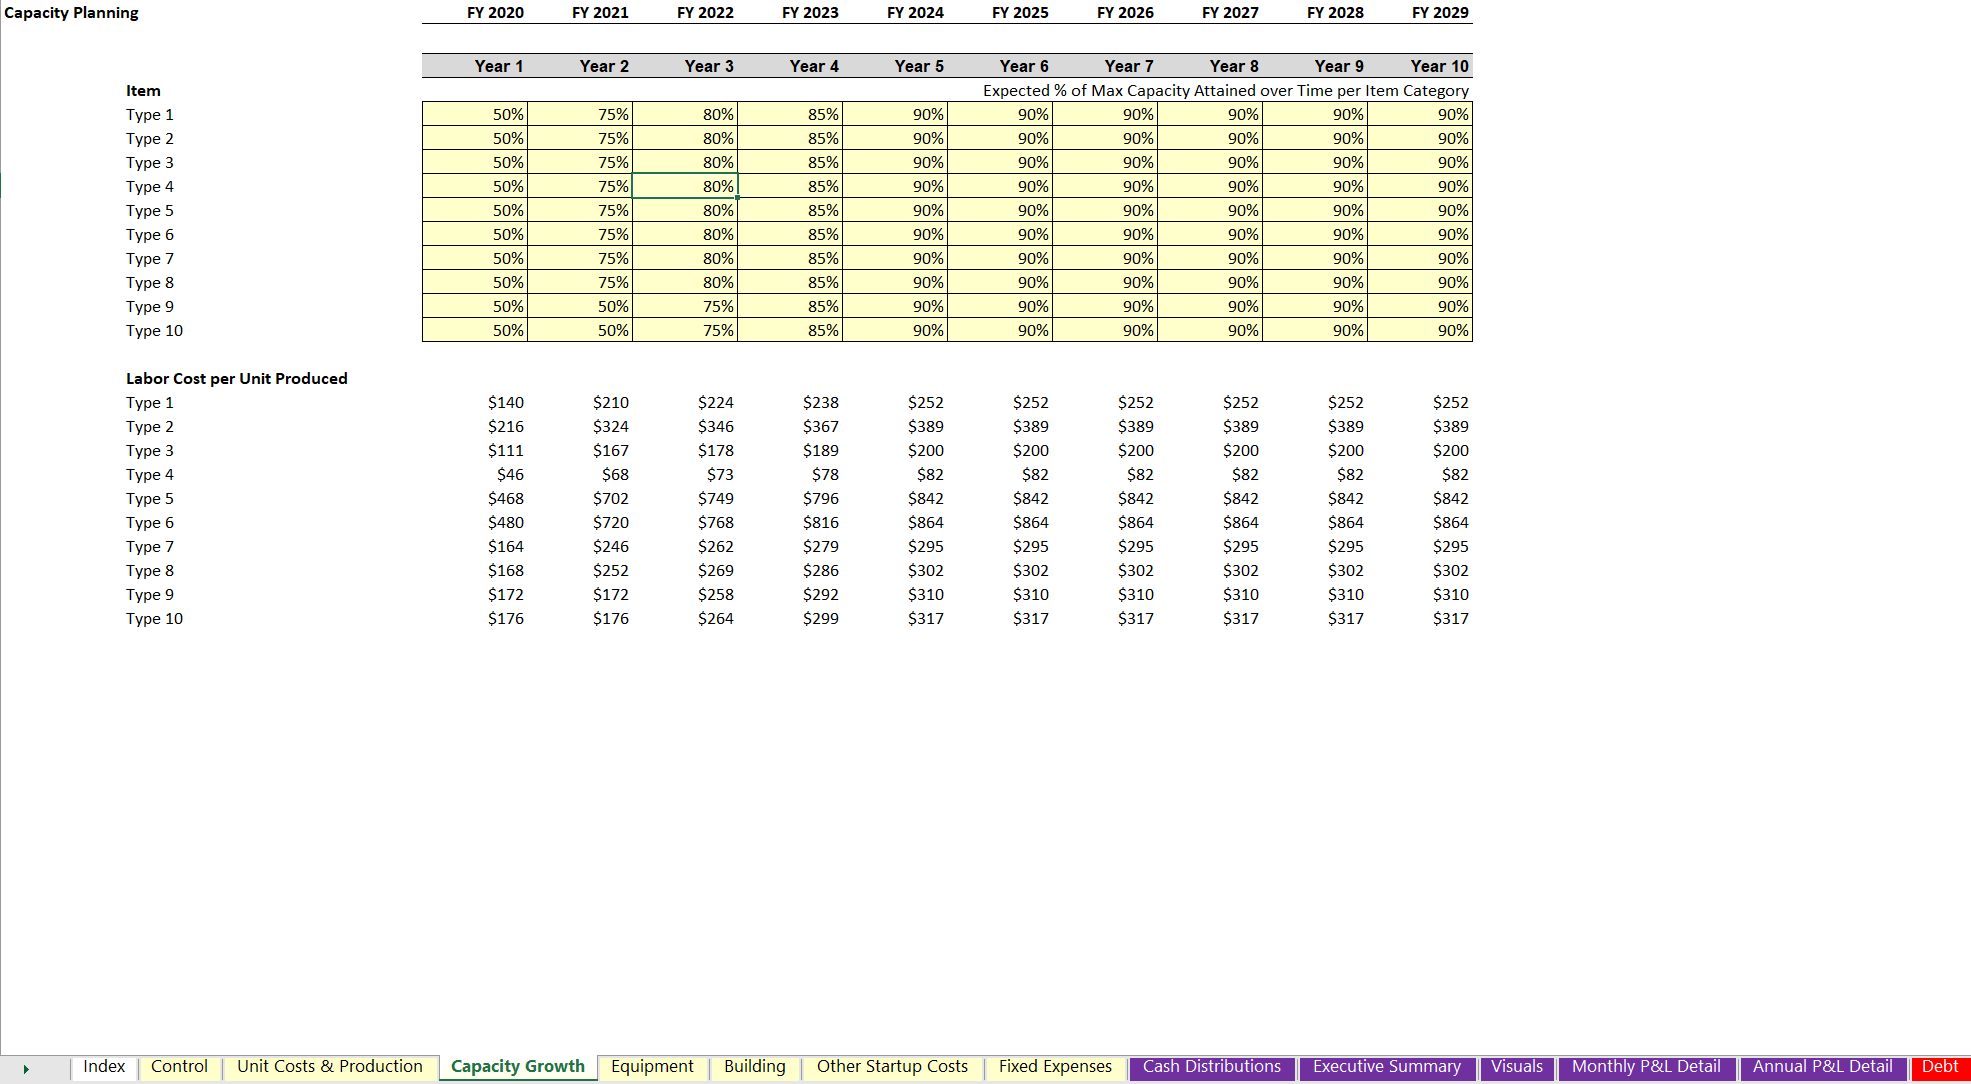
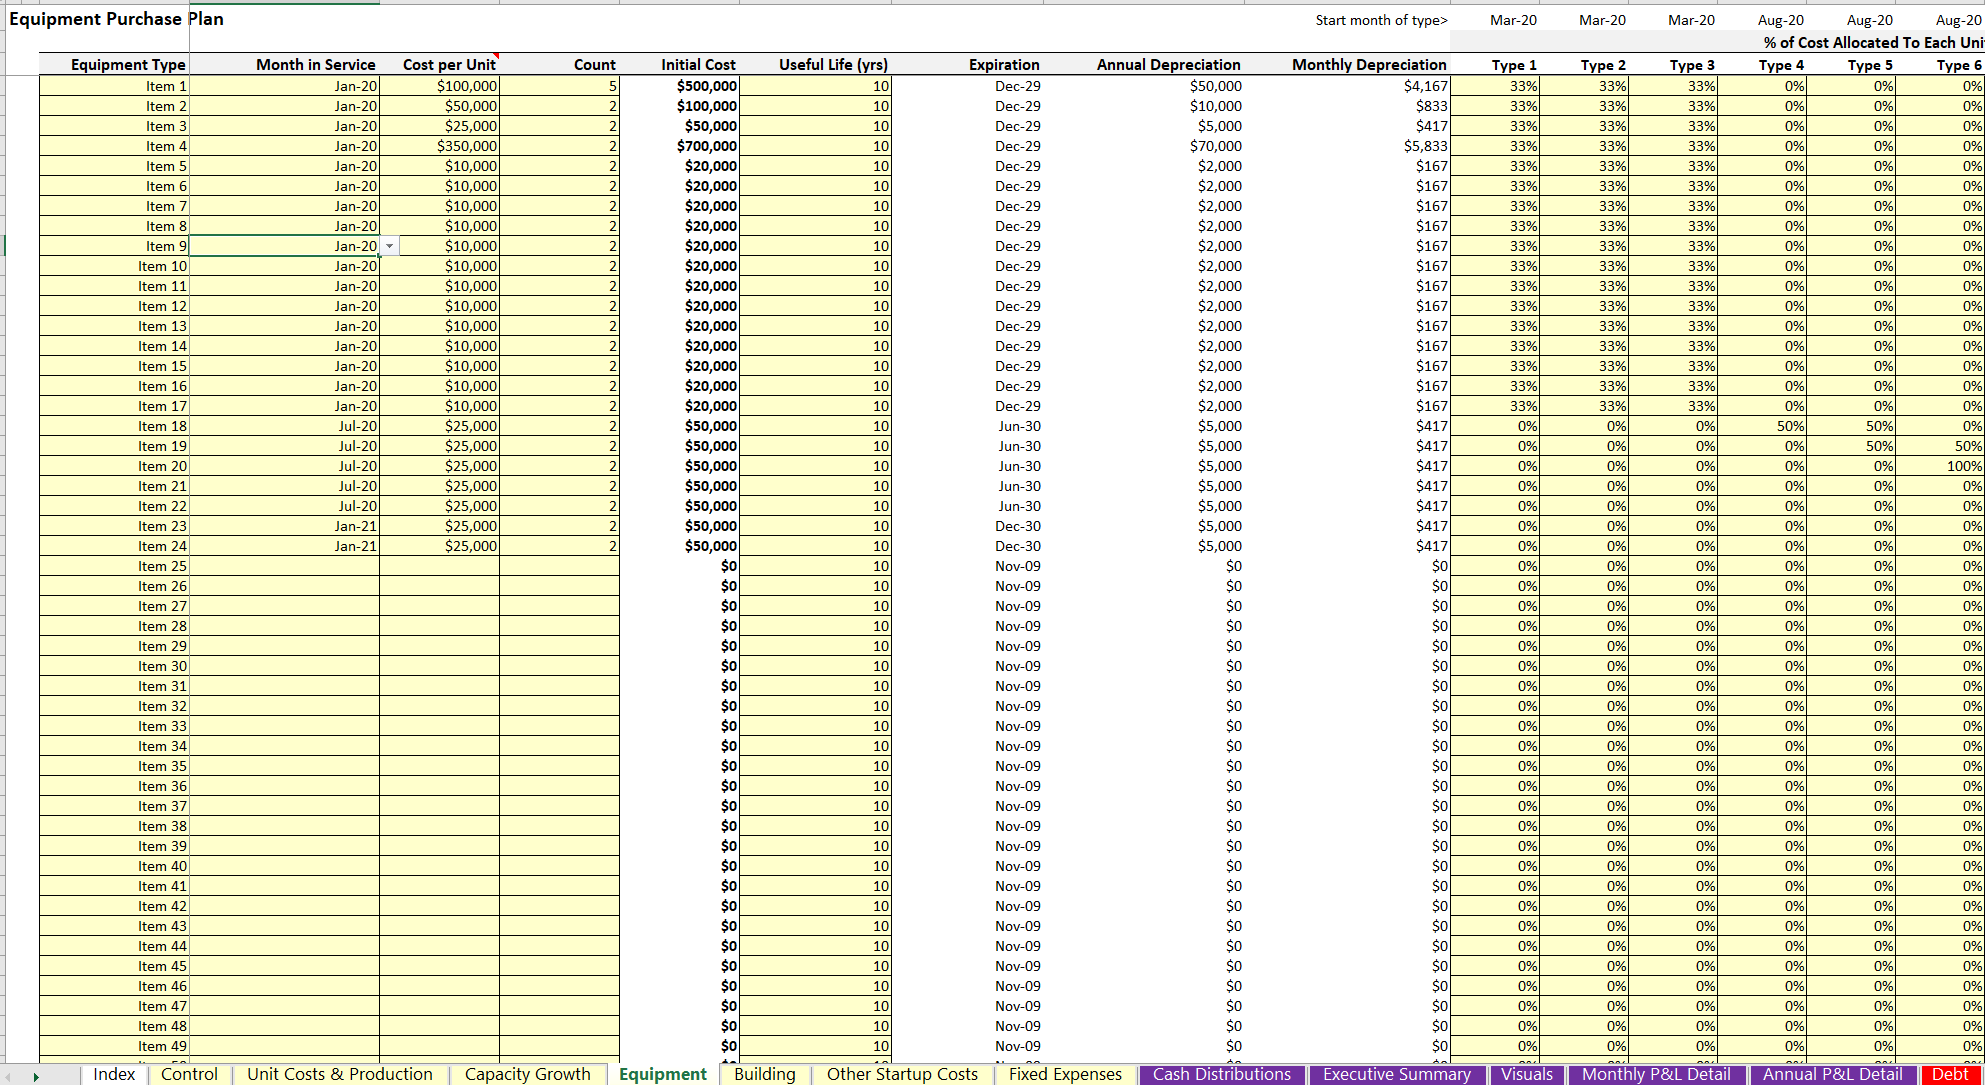
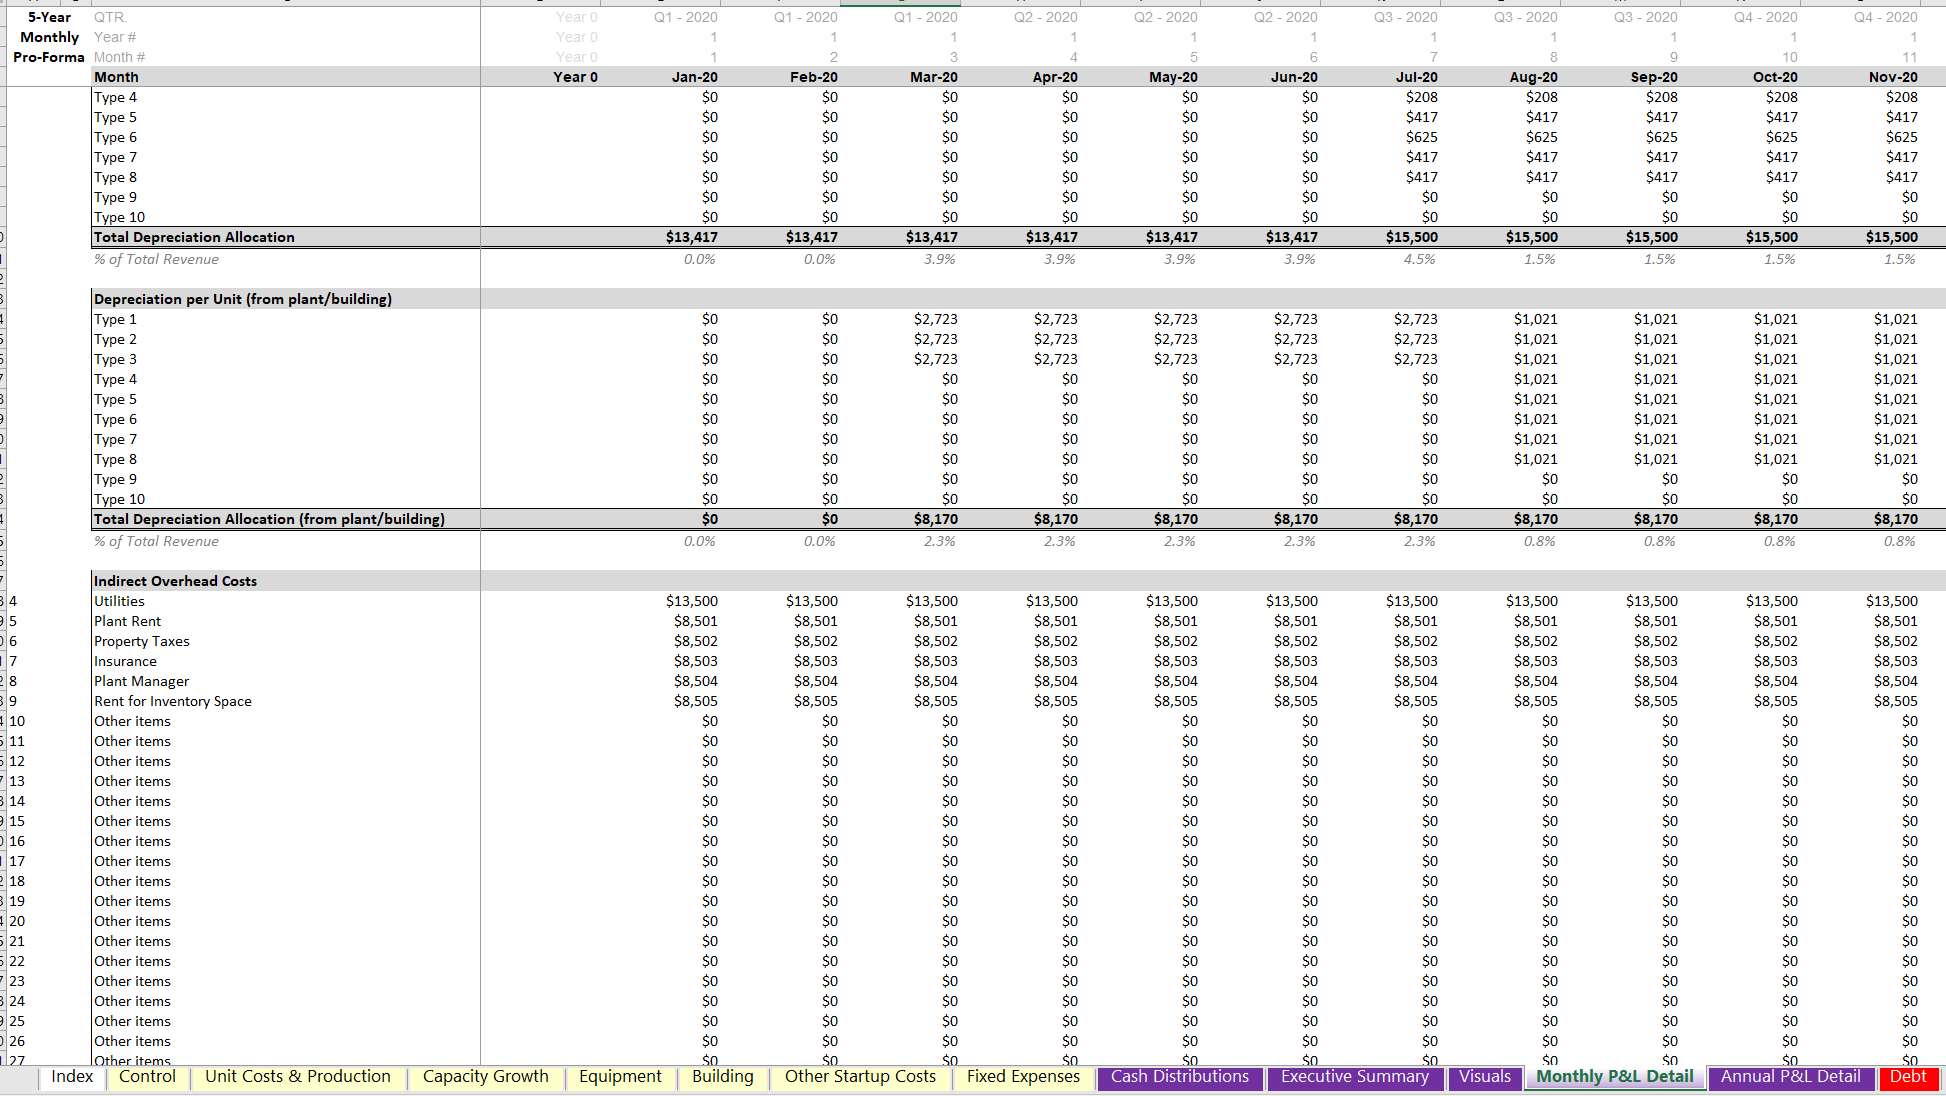
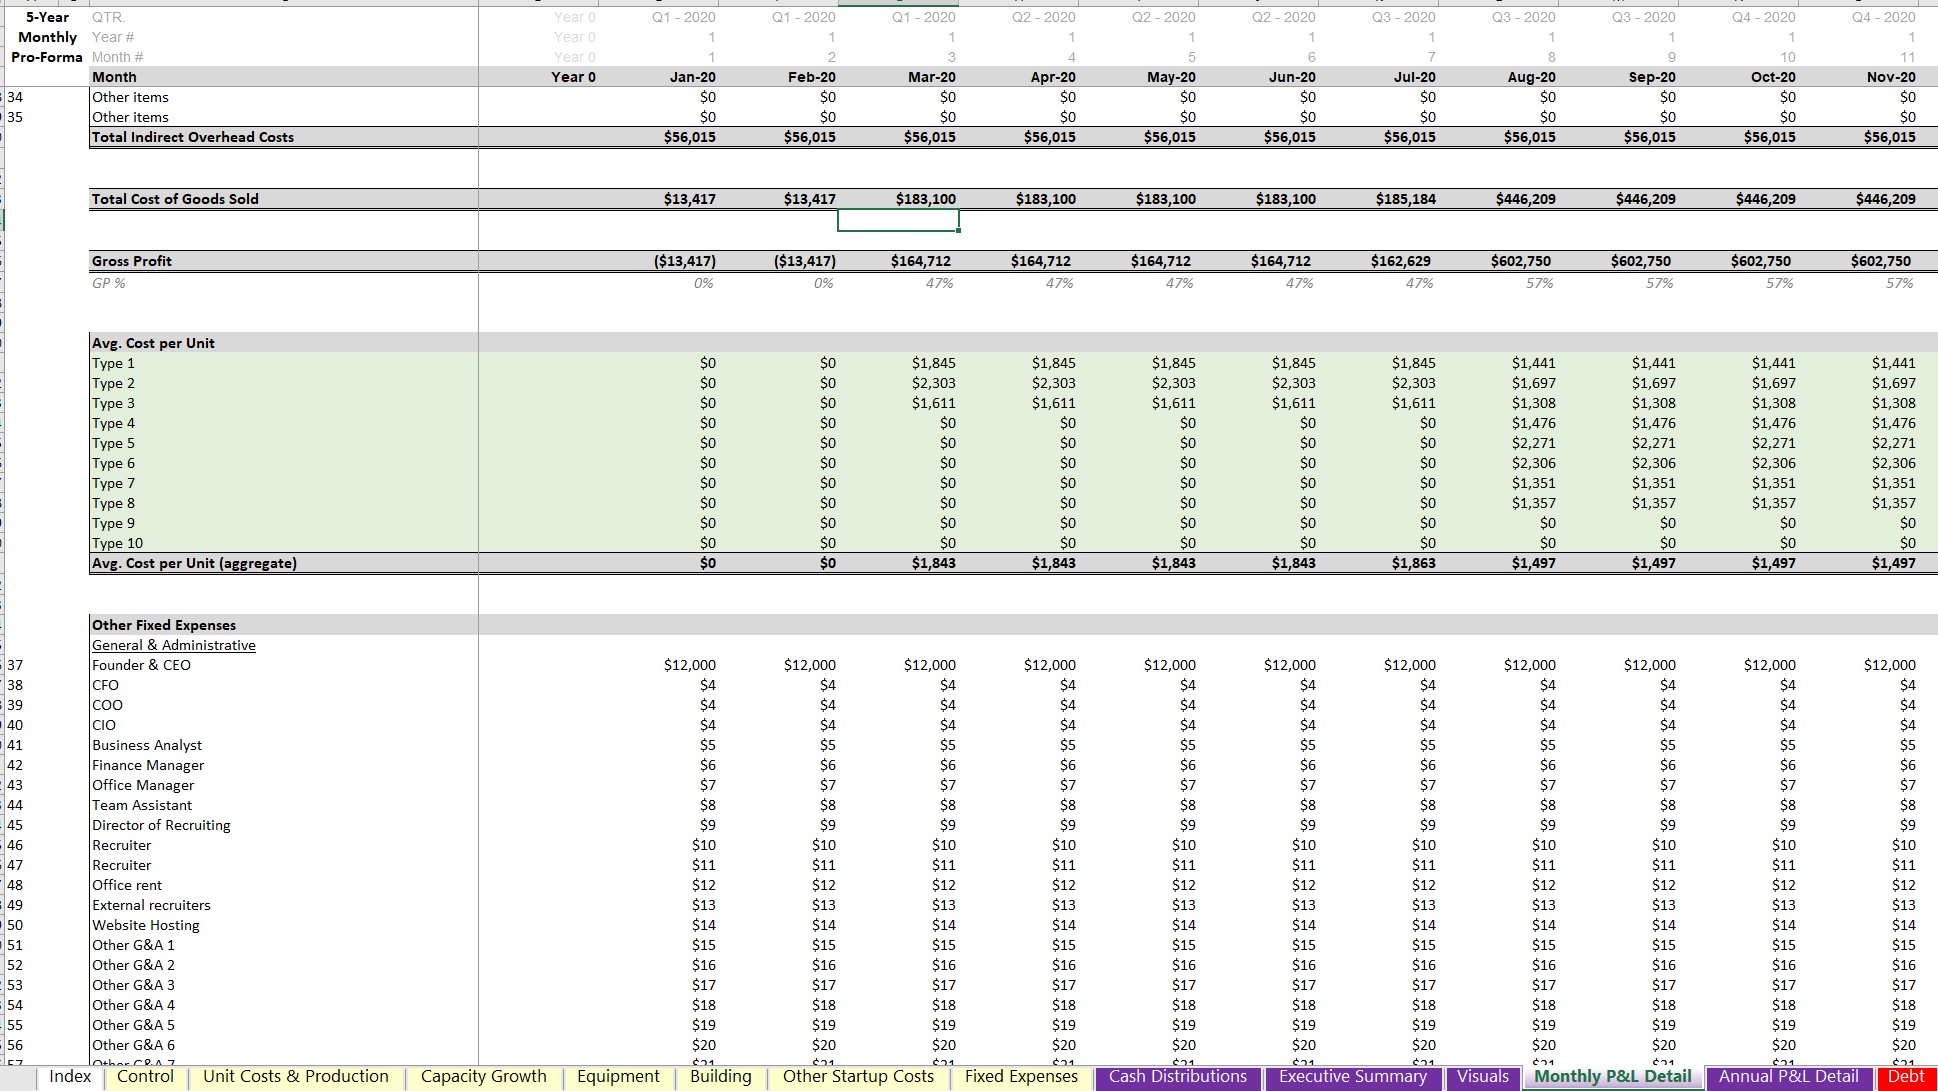
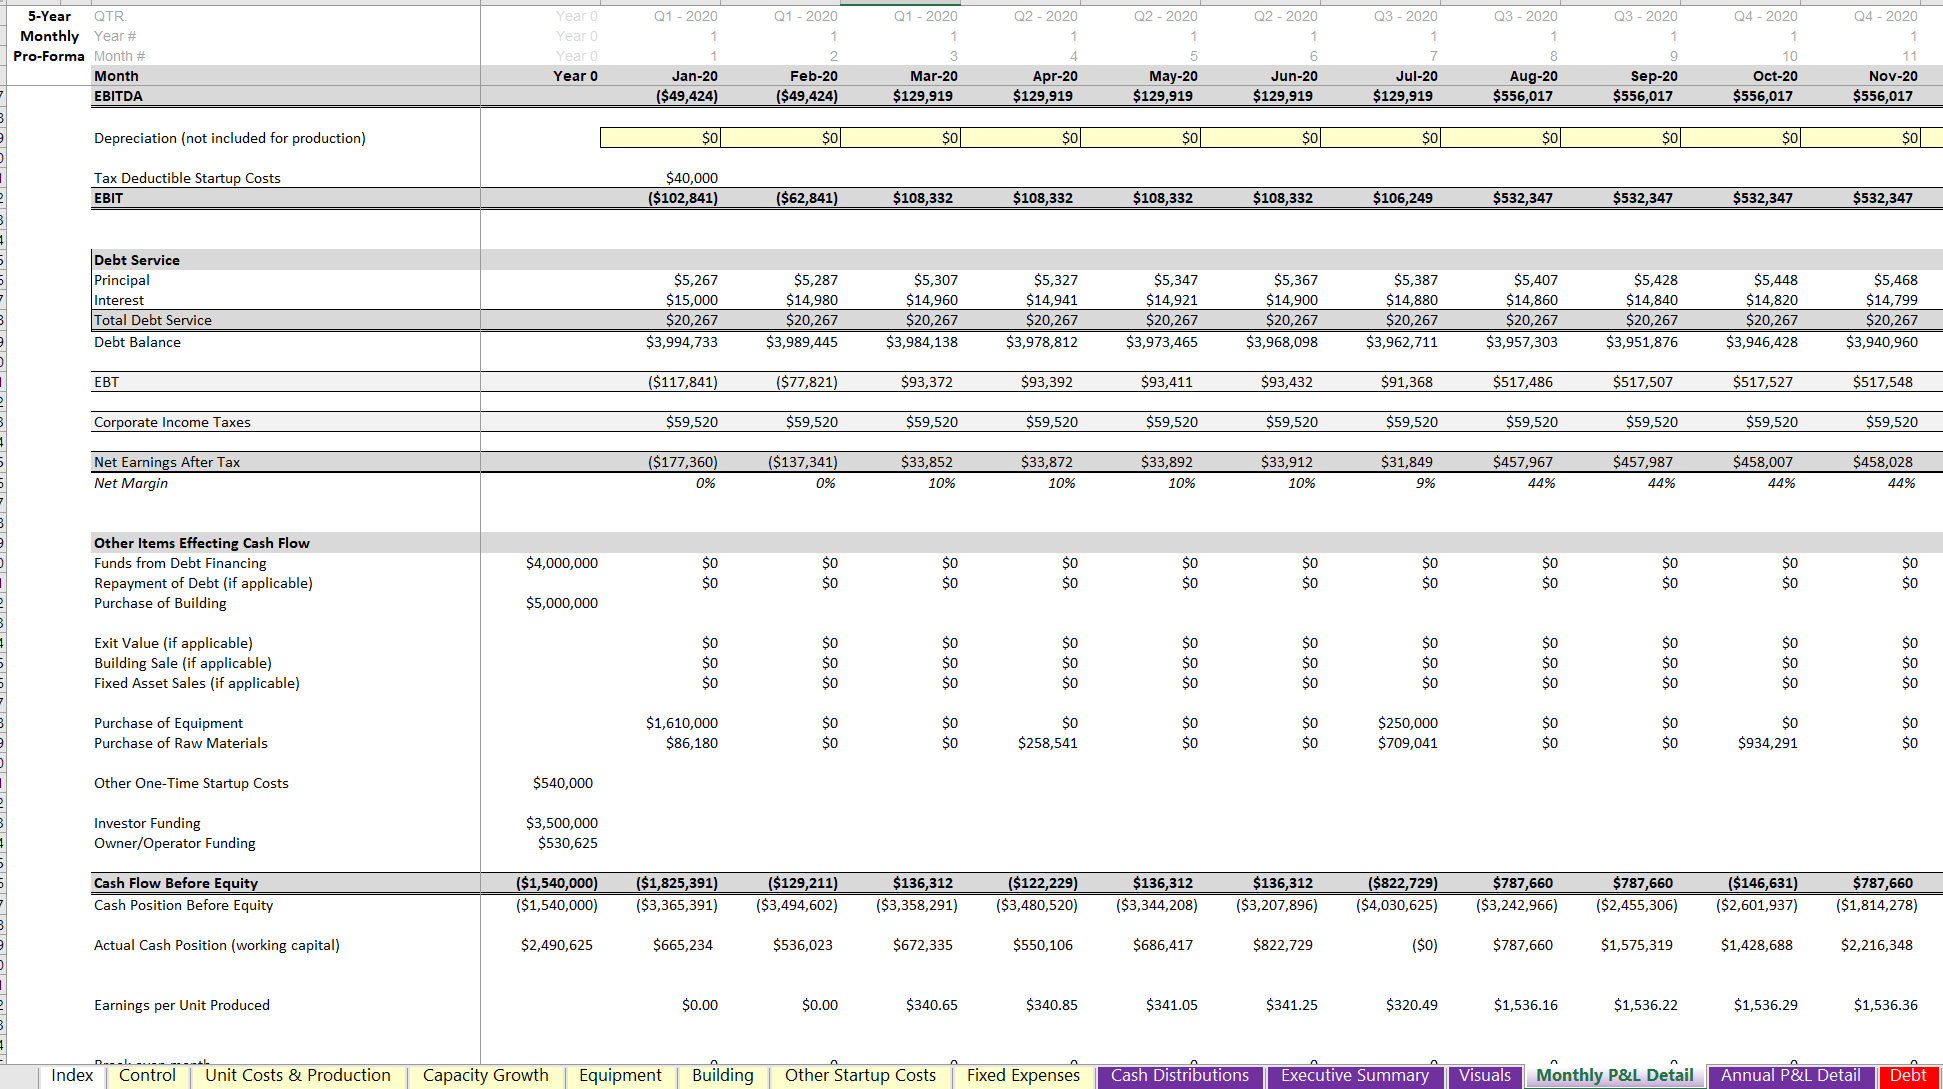
Manufacturing Plant Startup Financial Model - General Use

Type of Business :

Financial Models

Price : USD 75 75.00

Need More Clarifications/Customized Tool? Generate Ticket

Add to Wishlist icrest approved product

  • Short Description

    This is a 10-year monthly and annually manufacturing plant financial model. It is built in Excel and comes with a fully functional DCF Analysis and IRR summary. The assumptions and model in general are structured for the operation of a manufacturing plant where the company has bought/rented the actual building / facility and equipment/machinery. Dynamic logic was built in to determine the total cost of goods sold per unit accordingly.

  • Full Description

    All relevant costs to produce are broken out so that the following can be summarized by month: Units produced (up to 10 product category types), revenue per type, direct labor costs, Payroll taxes/benefits per direct labor per type, direct materials cost, indirect overhead per unit produced per type, depreciation per unit, and depreciation per unit (per plant/building). Those granular reports are necessary in order to get an accurate COGS (cost of goods sold), but the interesting logic that is fairly specific to manufacturing plant operations is that not all the items that can be directly attributed to COGS are cash items for that month. Some of it is depreciation and therefore has to be added back in when calculating bottom line monthly cash flow. All of this is accounted for in the model. All of these specific calculations also allow for outputs like average cost per unit per type (all inclusive) and earnings per unit produced. After the user enters all inputs regarding start year / exit month / multiple if applicable / funding sources, the main meat and potatoes of this spreadsheet is the revenue tab. On it, the user will define assumptions for up to 10 product categories that are being produced in the plant. Entries include: Expected Max Units Produced per Day, Operating Days per Year, Avg. Sale Price per Unit, Max Annual Labor Hours , Avg. Labor Rate , Avg. Labor Hours per, Day per Unit Type, Max Required Laborers , Avg. Daily Hours Spent per Laborer, Max Working, Days per Year , and Avg. Labor Cost per Unit Produced. Also, there are up to 25 direct material cost slots per product type. Capacity attained is defined on a per year basis in each of the 10 years per each product category. There is a separate schedule for equipment used in the plan and in order to get proper cost allocation per product type, you can enter an average percentage that each piece of equipment can be attributed to each product type. Other startup costs and fixed indirect operating costs are defined separately. All of these assumptions come together in a monthly and annual pro forma and cash flow summary. Plenty of visualizations help make it easier to see the driving forces and financial requirements/performance over 10 years.

  • Table of Content
    No. Content
    Index Tab Explains what is on each tab.
  • Reviews

    No Review. Write a review and be the first.

Related Products