Sign Up, Its Free

Join our Affiliate Program by simply copying the link of our products on your site and earn affiliate commission on every sale

Are you a Marketing expert, having some strategic tools? Come and Join as our Vendor

If you are a Vendor looking to sell tools in any specific category which is not present at the moment on our platform, for instance, say "Branding and Strategy." Simply, email us along with one of your sample business tools on "[email protected]" and we will add the same after verifying.

We have our showcased inventory as well so that the upcoming vendors can view the quality of business tools we are looking for.

What's New

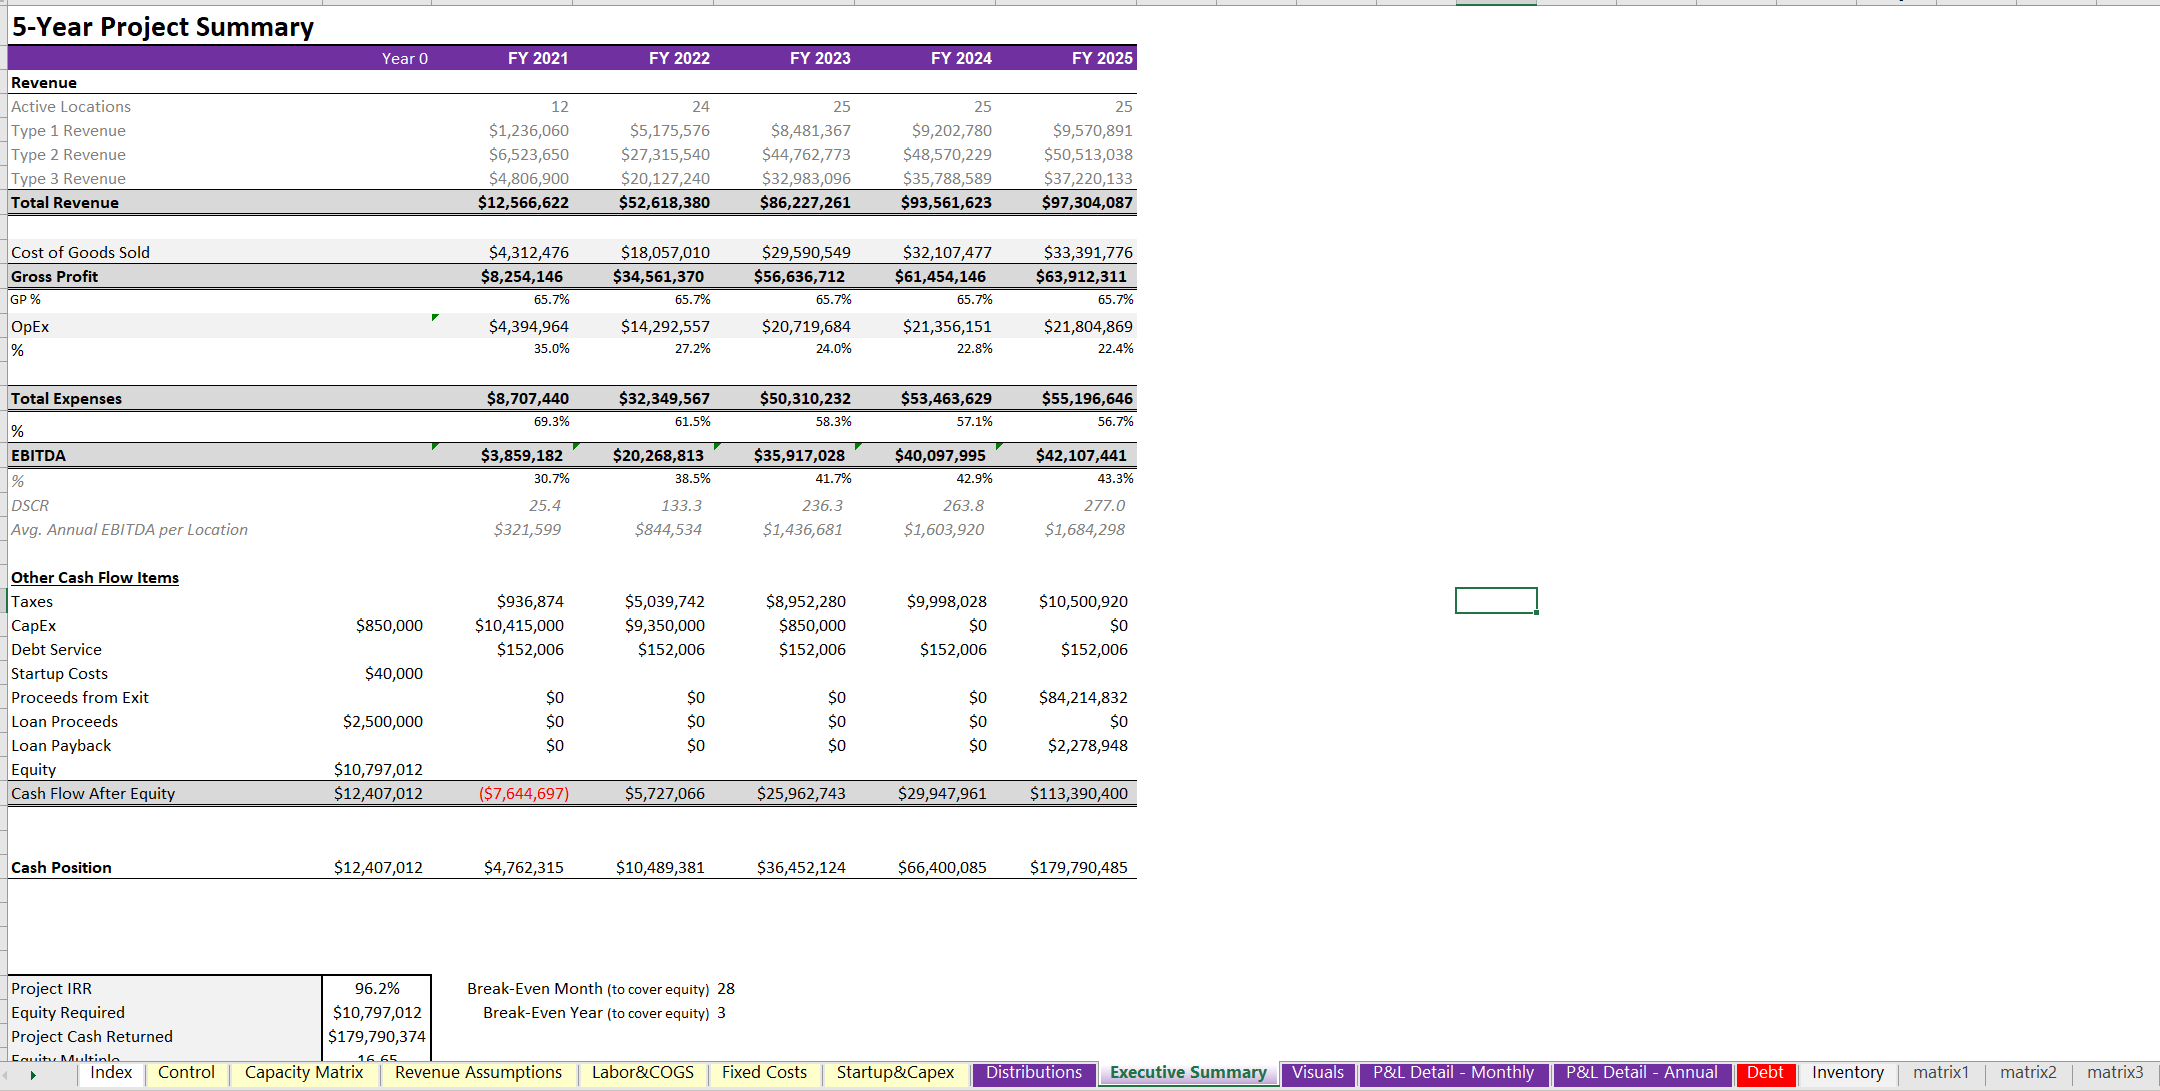
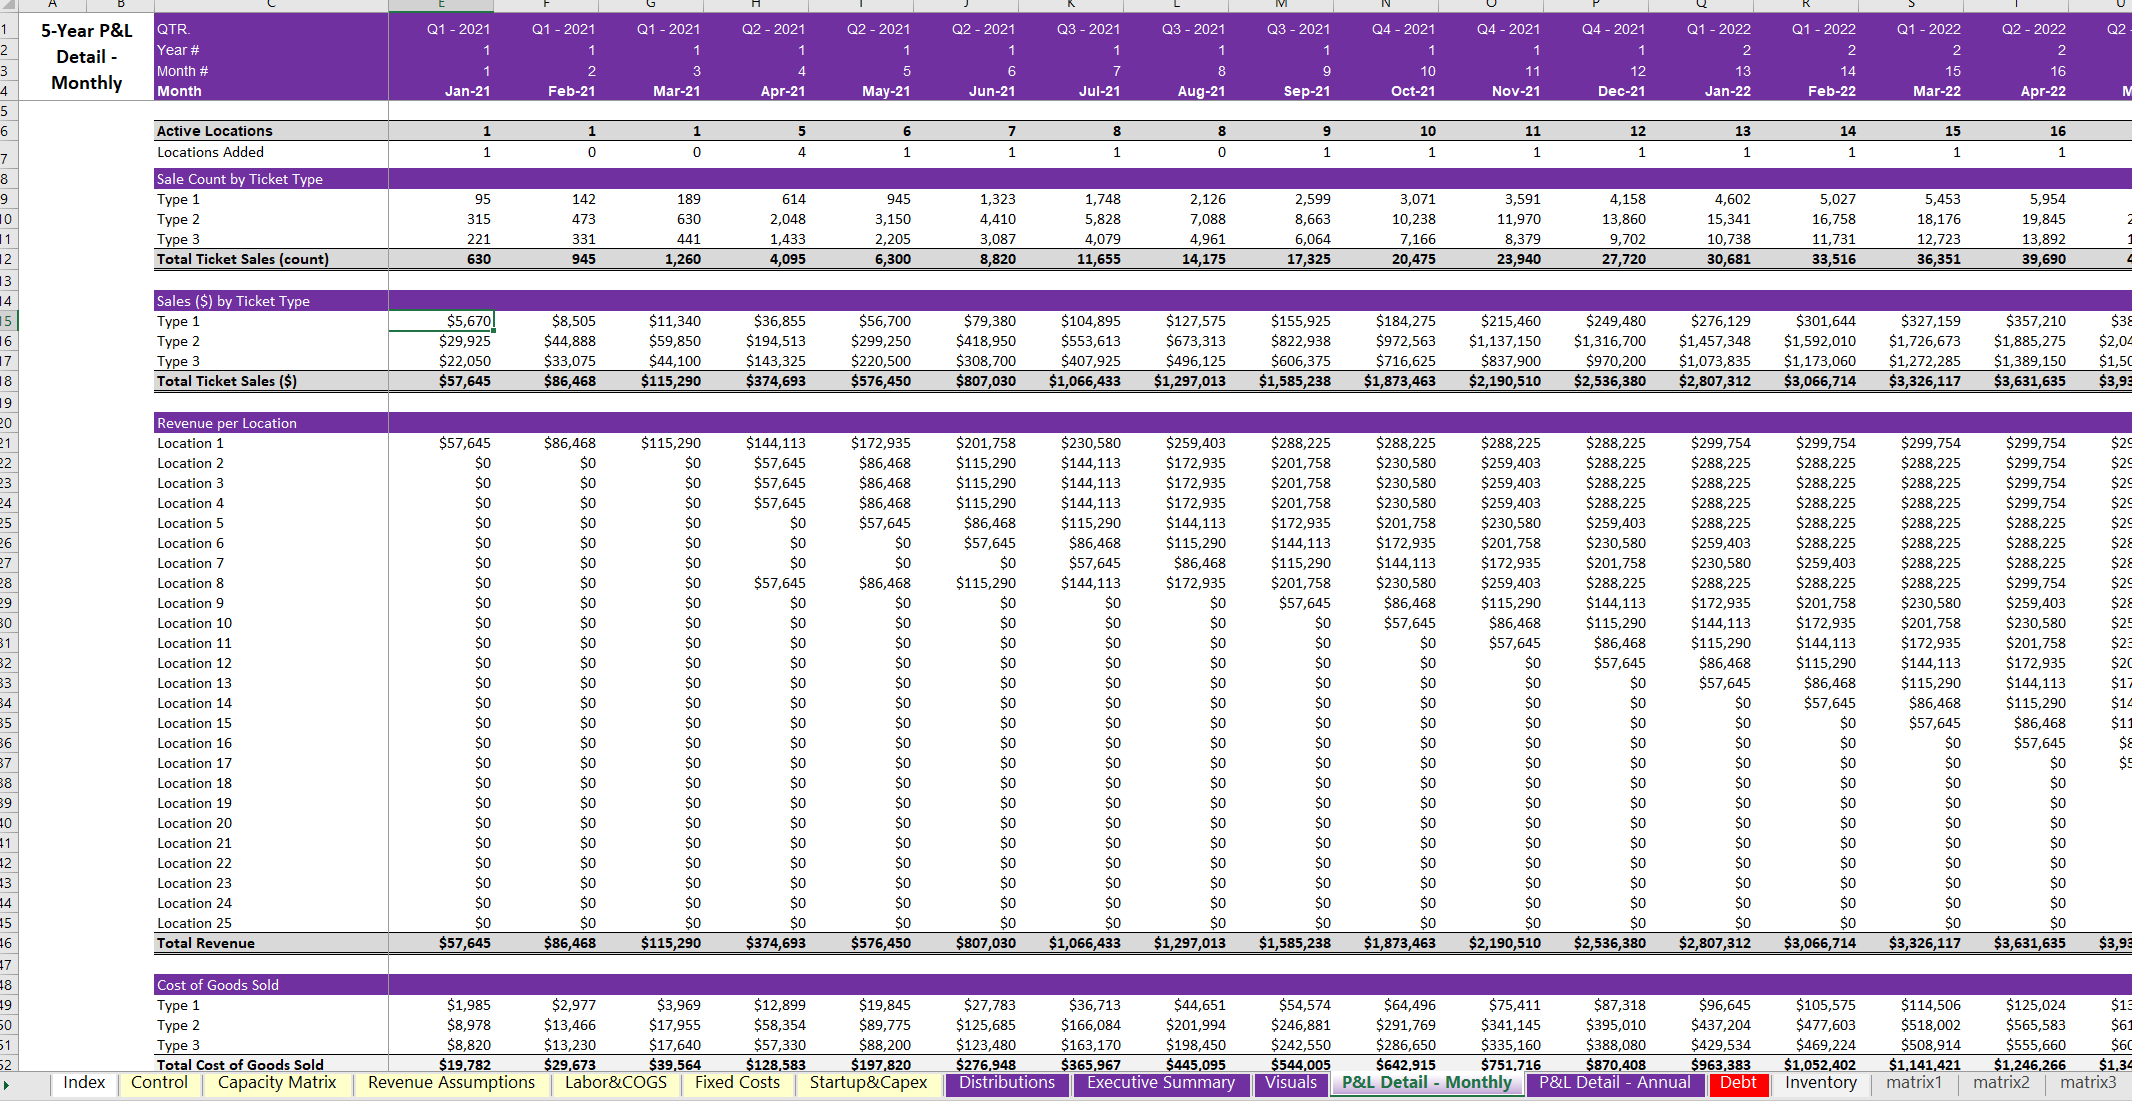
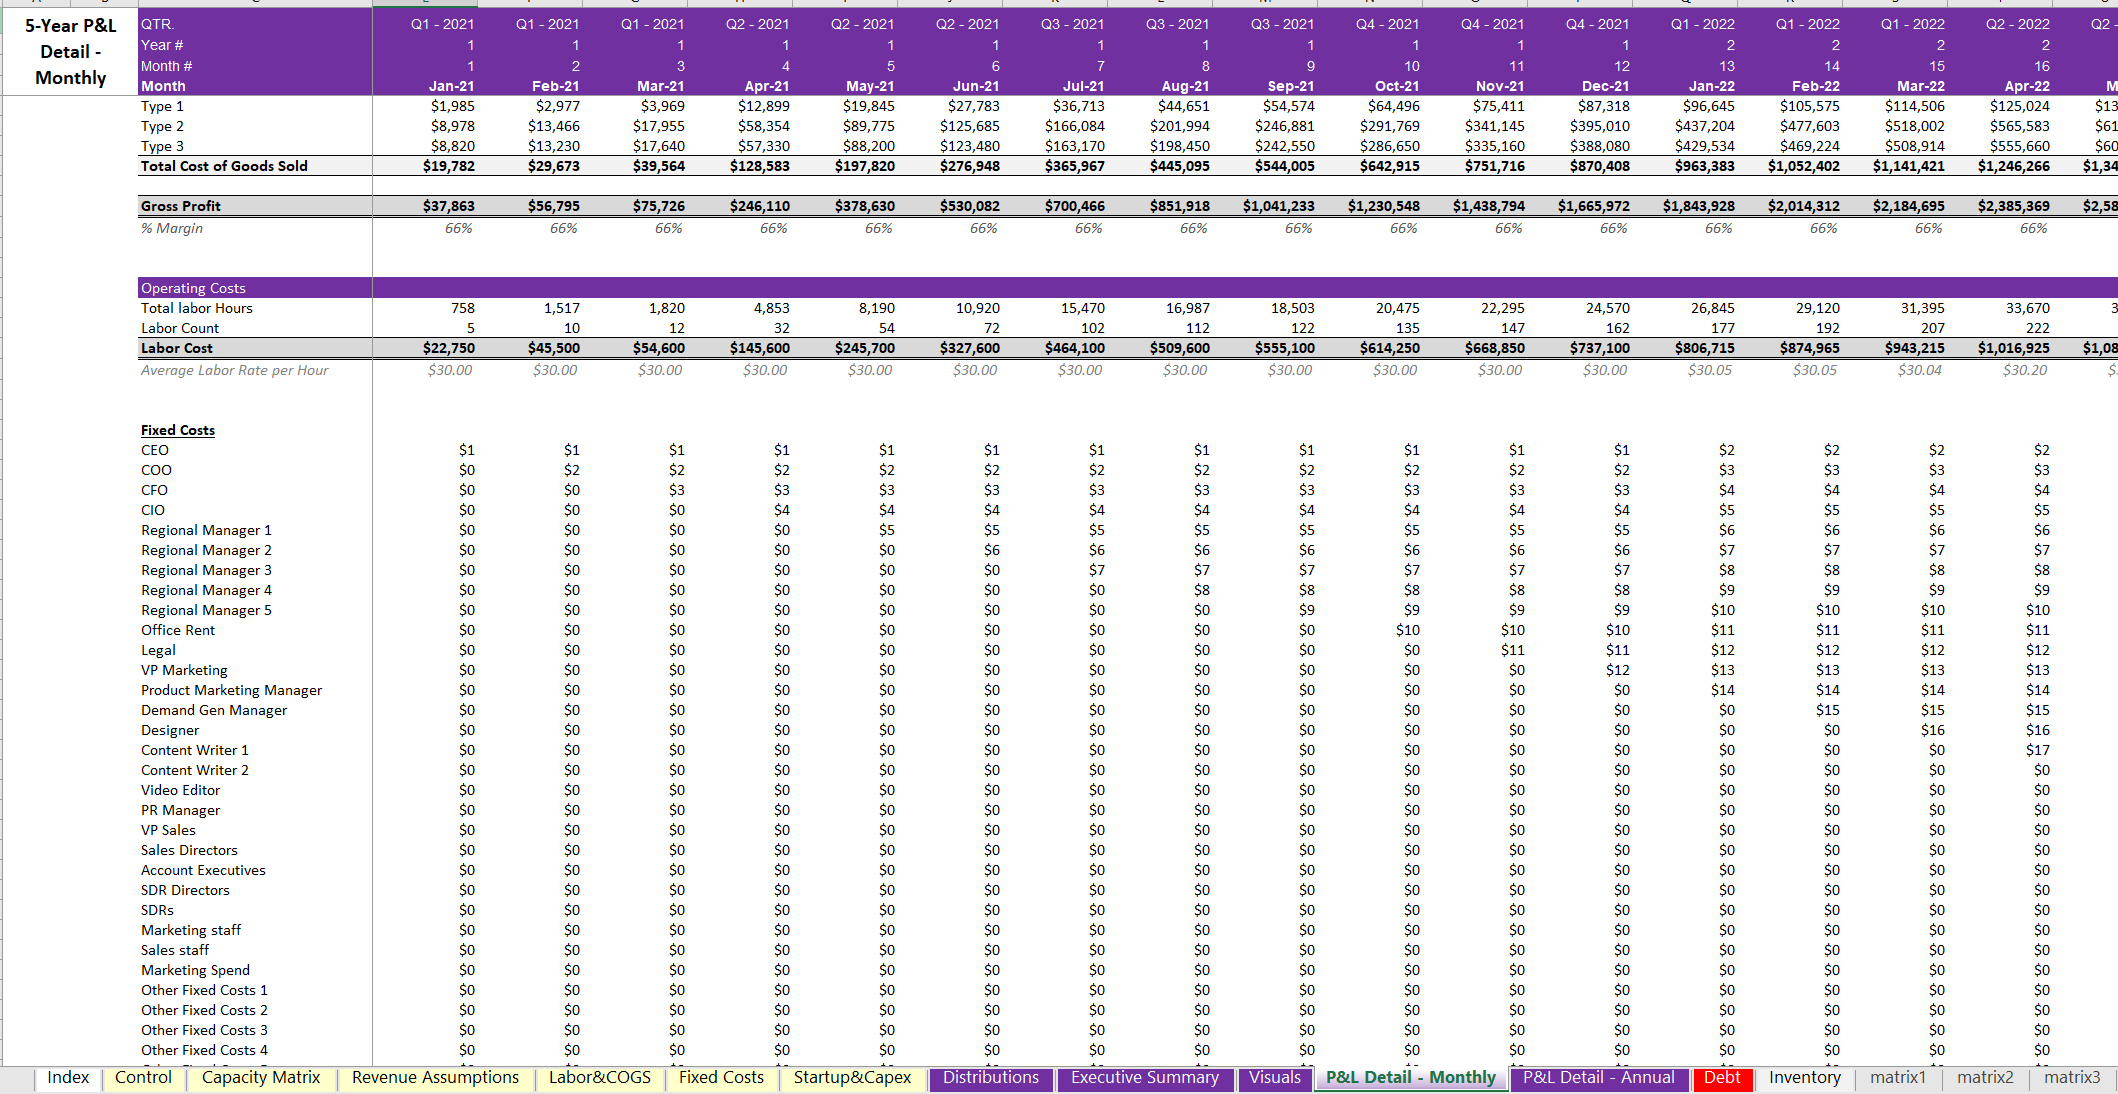
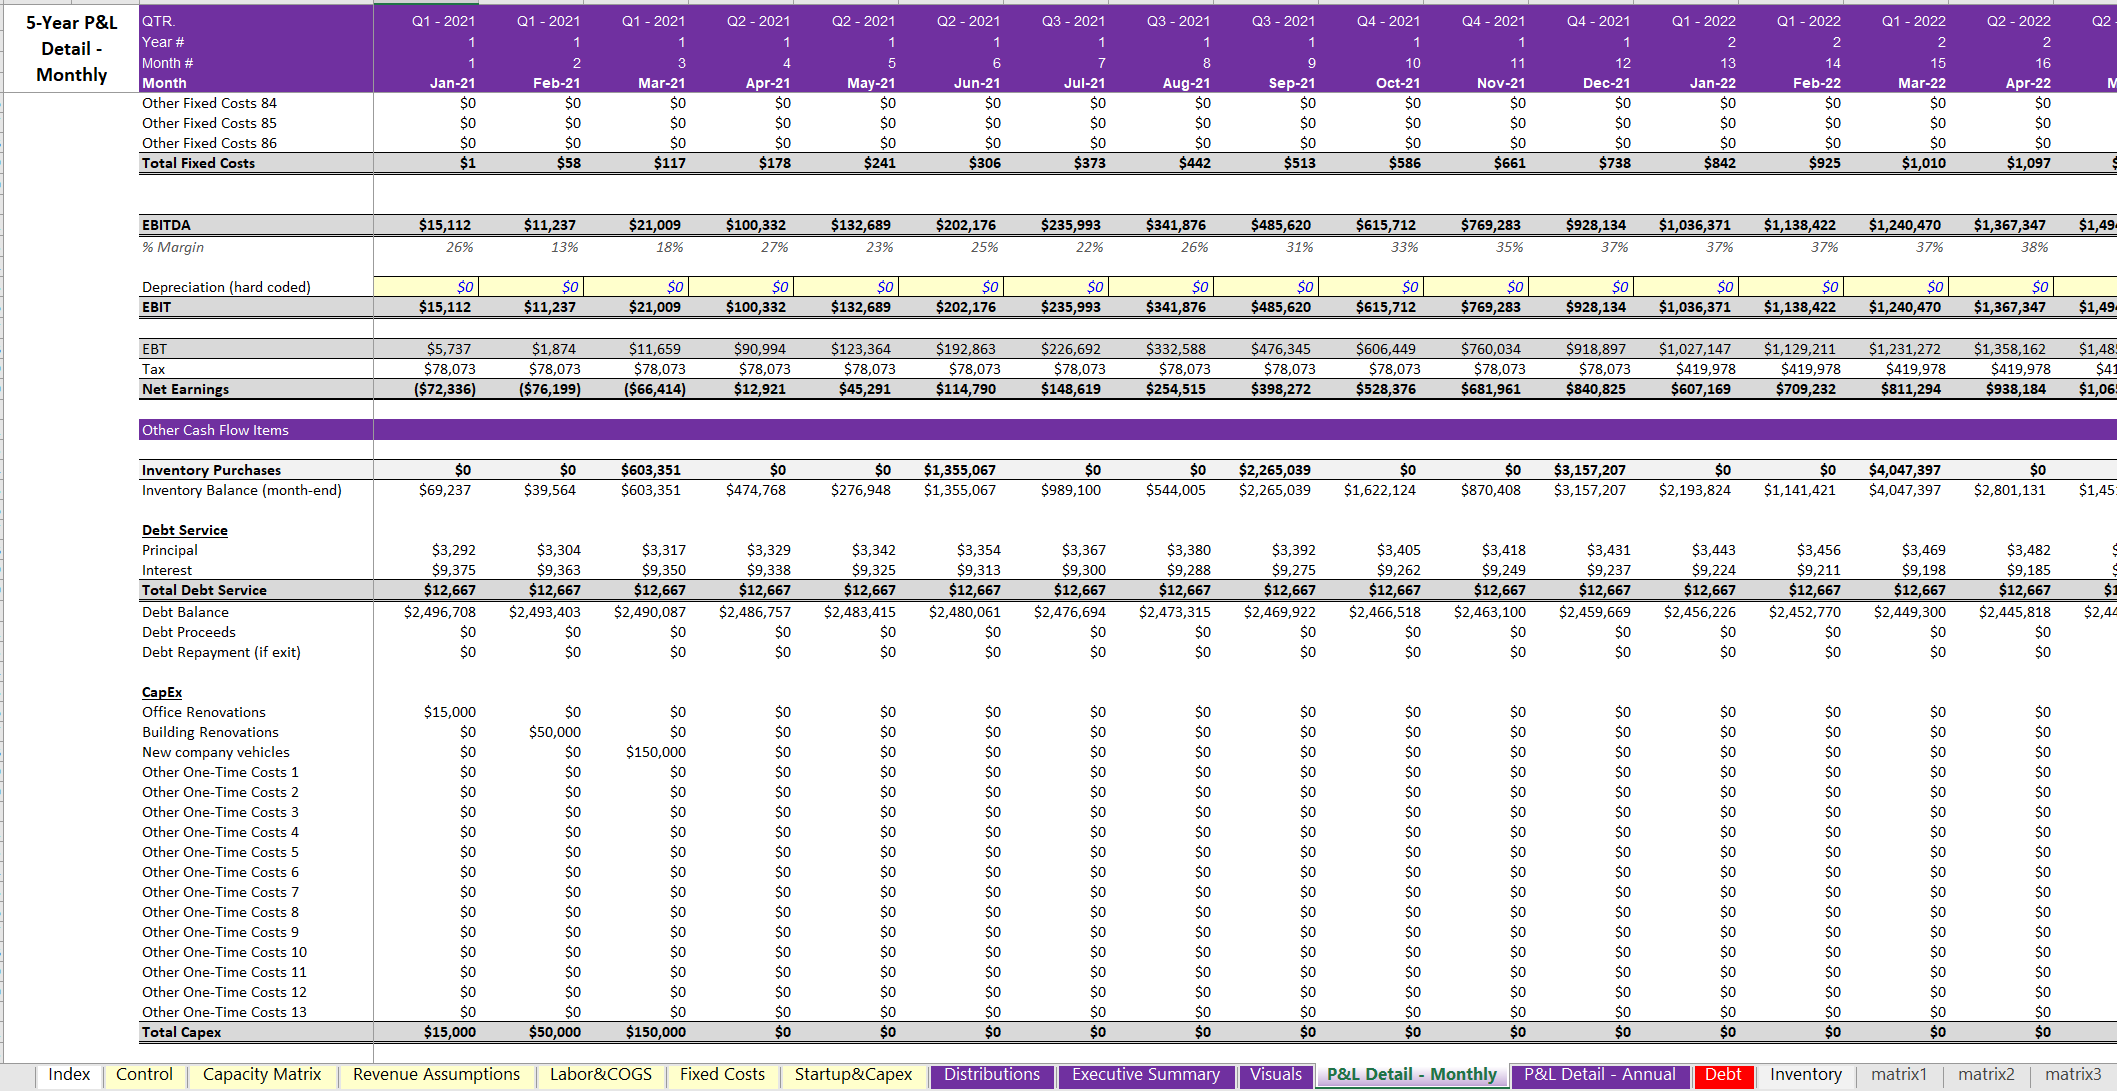
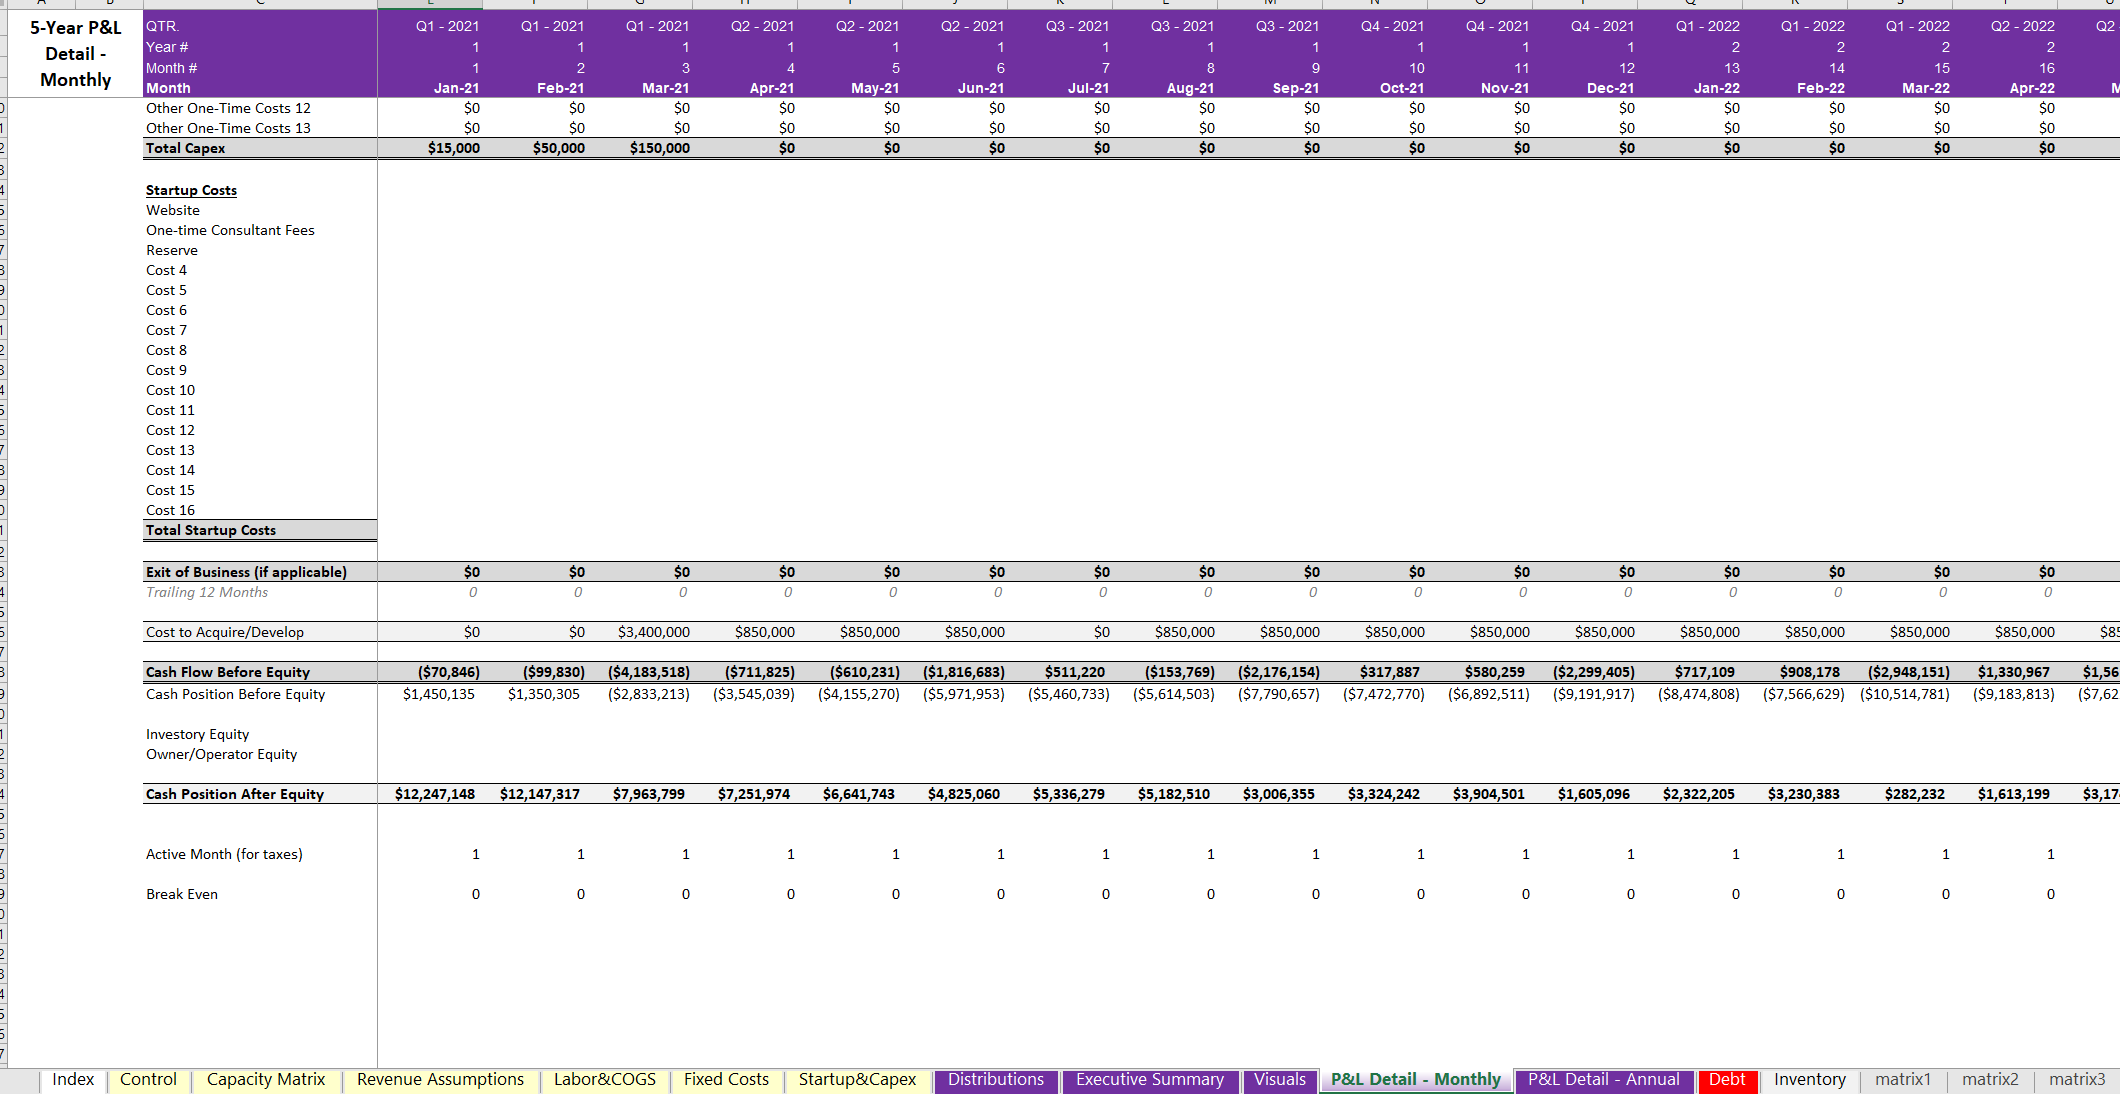
Modeling Up to 25 Storefront Acquisitions / Developments

Type of Business :

Financial Models

Price : USD 75 75.00

Need More Clarifications/Customized Tool? Generate Ticket

Add to Wishlist icrest approved product

  • Short Description

    No matter if you are planning on starting up a chain of franchises or scaling your own franchise / general chain of brick and mortar stores, this financial forecasting template will be a great help in figuring out the equity requirements and returns when modeling up to 25 storefront locations across 5 years of time (monthly and annual summaries).

  • Full Description

    The model starts out with ‘Revenue Assumptions’ defining general specifications for each of the 25 locations. The user can define the average ticket size for up to three general categories, the starting ticket capacity per day (maximum sales per day), the percentage of sales falling into each of the three categories, and the development / acquisition cost of each location. The user can also input a growth in maximum capacity for years 2 through 5 as well as the percentage of maximum capacity attained in the first 12 months of each location. Generally, a brick and mortar storefront will have labor, so each location has a defined labor count over the first 12 months and average hourly rate of laborers as well as average hours worked per week. Wage growth can be defined as a percentage each year as well. Cost of goods sold (if applicable) is a defined percentage and this rate applies to all locations. If the store has inventory, that can be defined as the months of inventory purchased ahead of time. This purchasing pattern will extrapolate through the rest of the model and cash flow is adjusted accordingly against the cost of goods sold and when the inventory is actually purchased. Fixed operating expenses are defined by a start month and the monthly cost over each of the five years. Startup and CapEx are also defined in their own schedules. A few advanced matrix tabs were built so all the timing could be accounted for properly in relation to when locations are developed/purchased and how all the cash requirements fall into place on the same monthly timeline. The final result is a total equity required for the entire endeavor and executive summaries as well as contribution and distribution reports based on all the assumptions. There are slots for funding via debt and equity (investors/owners) and a percentage of the company given to investors if applicable. Many visualizations are also included.

  • Table of Content
    No. Content
    Index Tab Explains what is on each tab.
  • Reviews

    No Review. Write a review and be the first.

Related Products