Sign Up, Its Free

Join our Affiliate Program by simply copying the link of our products on your site and earn affiliate commission on every sale

Are you a Marketing expert, having some strategic tools? Come and Join as our Vendor

If you are a Vendor looking to sell tools in any specific category which is not present at the moment on our platform, for instance, say "Branding and Strategy." Simply, email us along with one of your sample business tools on "[email protected]" and we will add the same after verifying.

We have our showcased inventory as well so that the upcoming vendors can view the quality of business tools we are looking for.

What's New

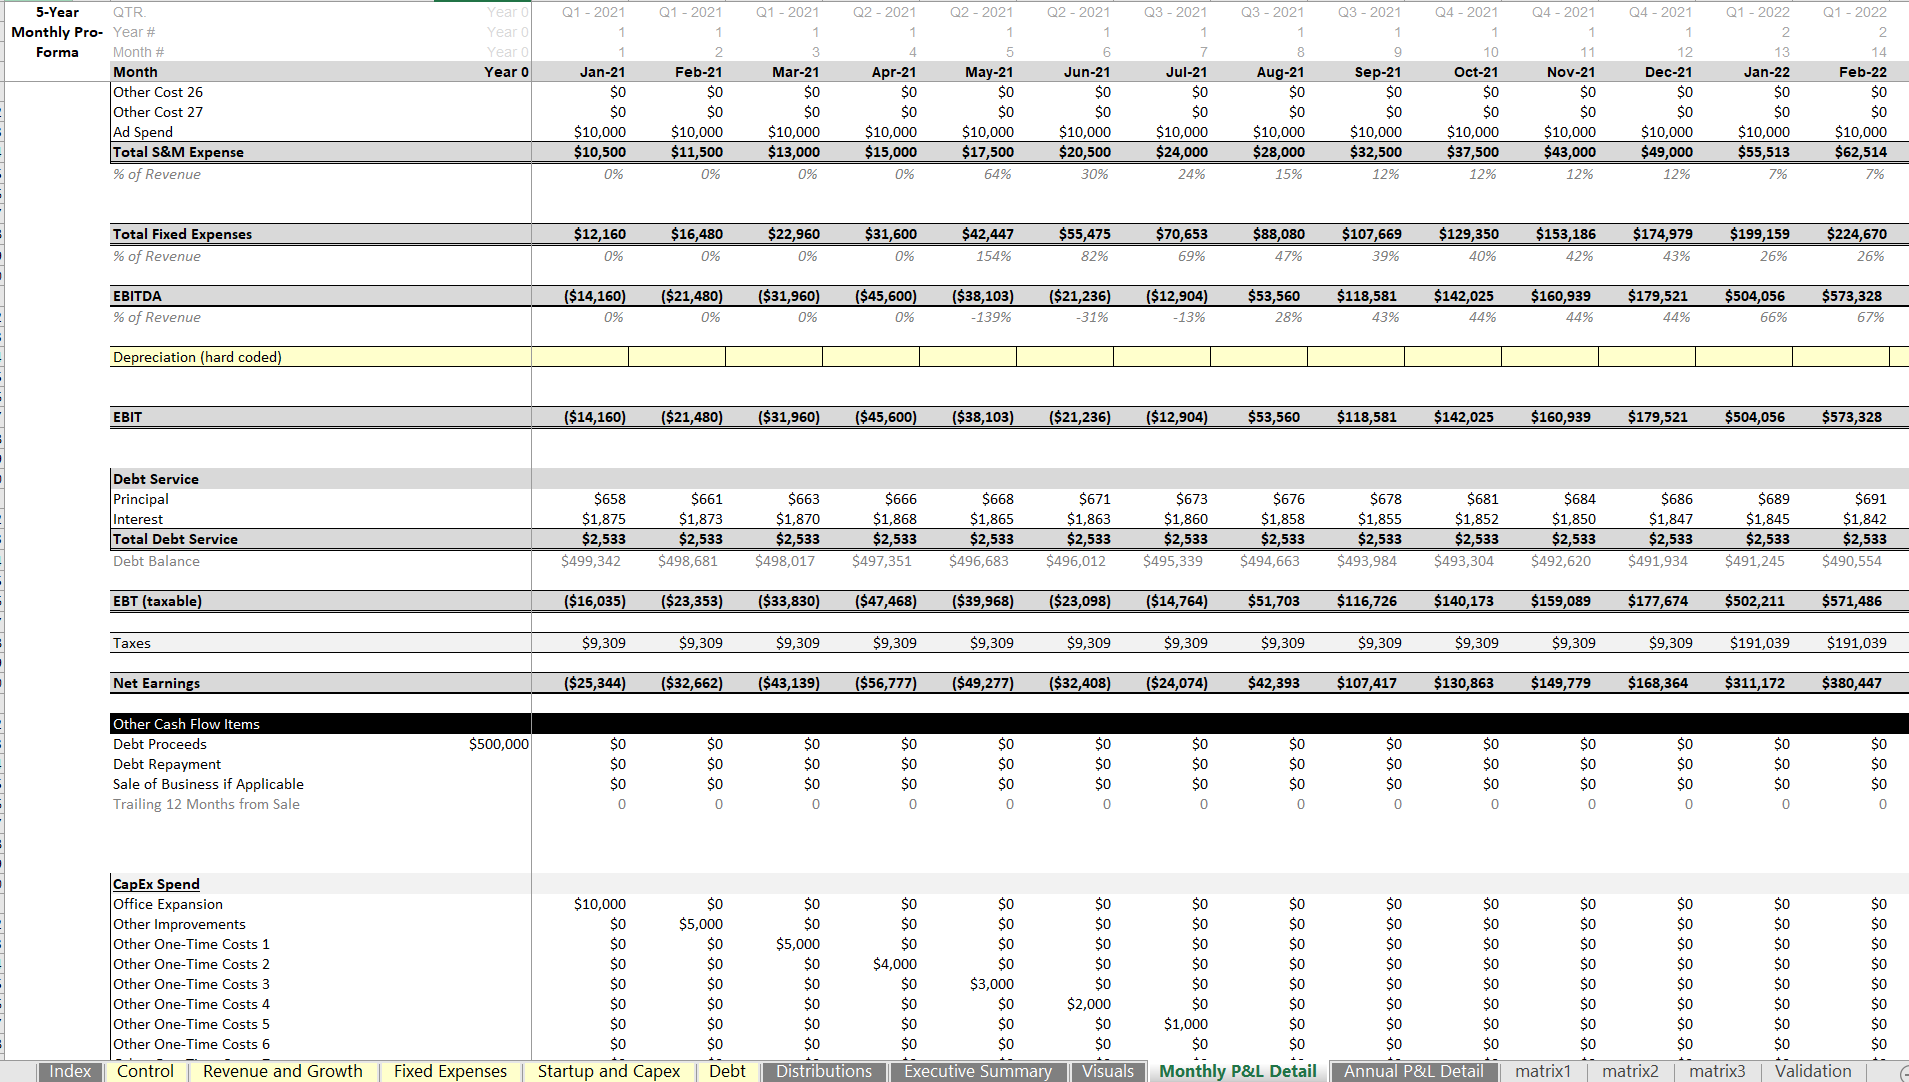
Mobile App Startup Financial Model: Multiple Revenue Drivers

Type of Business :

Financial Models

Price : USD 75 75.00

Need More Clarifications/Customized Tool? Generate Ticket

Add to Wishlist icrest approved product

  • Short Description

    5-year monthly and annual financial forecast for a mobile app. Specific revenue drivers are included for in-app purchases, ad revenue, and ad free fees. Up to 5 pricing cohorts for monthly in-app purchase amounts.

  • Full Description

    In general, mobile apps usually have a few things in common when it comes to how revenue is generated. They allow users to use their app for free and display ads (ad revenue). They allow users to pay for ad free usage (ad free fees). Finally, they allow users to buy things within the app (in-app purchases). This model has configurable assumptions surrounding all of those revenue streams and they are adjustable in each of the 5 years. The model drives users based on a few different acquisition methods. The first is by ad spend and a defined CPA (cost per acquisition). The second is through organic users that sign up through word of mouth/direct search. The free user pool will drive ad revenue as well as some of the in-app purchases. The number of total users (free and paid) that decide to make in-app purchases while they are still on the platform is defined by a percentage. There are up to 5 pricing tiers and a percentage of users that purchase something from each tier is also configurable. The tiers are not mutually exclusive. A defined retention rate exists for all users and this will drive how long a given monthly cohort will be active on the app i.e. the user of this model will define the average length of time the average user stays on the app (in years) and this can be less than 1 as well as a decimal. As long as users from a given cohort are active, they will be subject to the assumptions around how much revenue is generated. A given cohort slowly diminishes in count per the retention rate. Annual executive summary and contribution/distribution summaries exist for how funding is sourced and available cash distributions are shared if investor equity was used. Terminal value will populate if an exit month is selected and it is based on trailing 12-month revenue multiplied by a defined multiple. Any debt that is left will automatically be repaid upon the exit month as well if debt assumptions were defined. Key metrics are displayed in charts and include: CaC, CaC to LTV ratio, month to pay back CaC, churn, and average. Monthly revenue/gross profit per user.

  • Table of Content
    No. Content
    Control Handle project level assumptions, equity shares, and debt assumptions.
    Revenue and Growth Assumptions related to user acquisition and all three revenue streams as well as retention rate.
    Fixed Expenses Establish planned hires of executive team and general running costs on a monthly basis over 5 years.
    Startup & Capex Enter single startup costs that happen prior to operations as well as future one-time expenditures.
    Debt Enter assumptions about any loans you plan on having.
    Distributions Displays the distributable cash flow and the distributions of that to owner equity and investor equity.
    Executive Summary Displays high level financial metrics.
    Visuals An assortment of performance visuals.
    Monthly P&L Detail A detailed summary of unit sales, subscriber growth, costs, and cash flow on an annual basis.
    Annual P&L Detail A detailed summary of unit sales, subscriber growth, costs, and cash flow on a monthly basis.
    Matrix1 Logic for free pool user retention
    Matrix2 Logic for paid pool user retention
    Matrix3 Logic for payroll taxes and benefits
  • Reviews

    No Review. Write a review and be the first.

Related Products