Sign Up, Its Free

Join our Affiliate Program by simply copying the link of our products on your site and earn affiliate commission on every sale

Are you a Marketing expert, having some strategic tools? Come and Join as our Vendor

If you are a Vendor looking to sell tools in any specific category which is not present at the moment on our platform, for instance, say "Branding and Strategy." Simply, email us along with one of your sample business tools on "[email protected]" and we will add the same after verifying.

We have our showcased inventory as well so that the upcoming vendors can view the quality of business tools we are looking for.

What's New

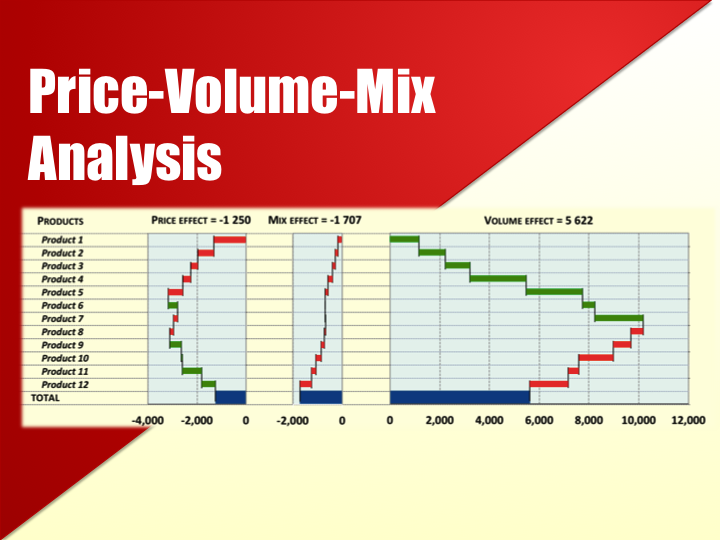
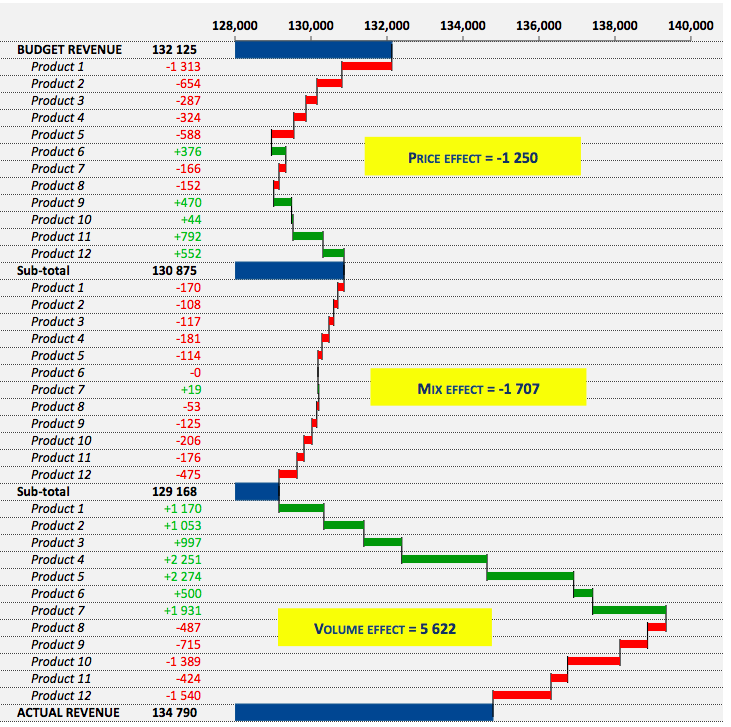
Price-Volume-Mix Analysis

Type of Business :

Financial Model Templates

Price : USD 45 45.00

Need More Clarifications/Customized Tool? Generate Ticket

Add to Wishlist icrest approved product

  • Short Description

    This publication delivers tools and methods to calculate and depict price, volume and mix effects. It also talks about variance analysis in general. If your company sells more than one product, you will at some point start wondering which products and to what extent were driving the change in total revenue or profit.

  • Full Description

    This publication delivers tools and methods to calculate and depict price, volume and mix effects. It also talks about variance analysis in general. If your company sells more than one product, you will at some point start wondering which products and to what extent were driving the change in total revenue or profit. This can be the change between current and prior year, or between budget and actual. As such, the following types of analysis will come in handy: 1. Compare total revenues product-by-product and see which of them affected the revenue (profit) change to the biggest extent (both positively and negatively) 2. Price elasticity. Estimate how reactive the market is to price change. Has the change in prices led to a change in volumes? Has the price increase brought in higher revenues or were they swallowed by reduced volumes? Have you been better off reducing prices this year in terms of the total change in profits? 3. Split the revenue change into three components: price effect, mix effect and volume effect. Have we done a good job pushing the volumes? Have we given enough effort to selling more expensive (profitable) products? Have we made a trade off between volumes and prices? As a bonus, the publication explains in detail how to create a horizontal waterfall chart. This is a smart and efficient type of chart visualizing variances between the numbers. It will surely make your presentations look professional and your reports - impress your clients, managers and colleagues. Compatible with all versions of Excel.

  • Table of Content
    No. Content
    PVM analysis Price effect, Volume effect, Mix effect
    Elasticity Price elasticity analysis
    Variances Overall analysis of revenue and profit variance
  • Reviews

    No Review. Write a review and be the first.

Related Products