Sign Up, Its Free

Join our Affiliate Program by simply copying the link of our products on your site and earn affiliate commission on every sale

Are you a Marketing expert, having some strategic tools? Come and Join as our Vendor

If you are a Vendor looking to sell tools in any specific category which is not present at the moment on our platform, for instance, say "Branding and Strategy." Simply, email us along with one of your sample business tools on "[email protected]" and we will add the same after verifying.

We have our showcased inventory as well so that the upcoming vendors can view the quality of business tools we are looking for.

What's New

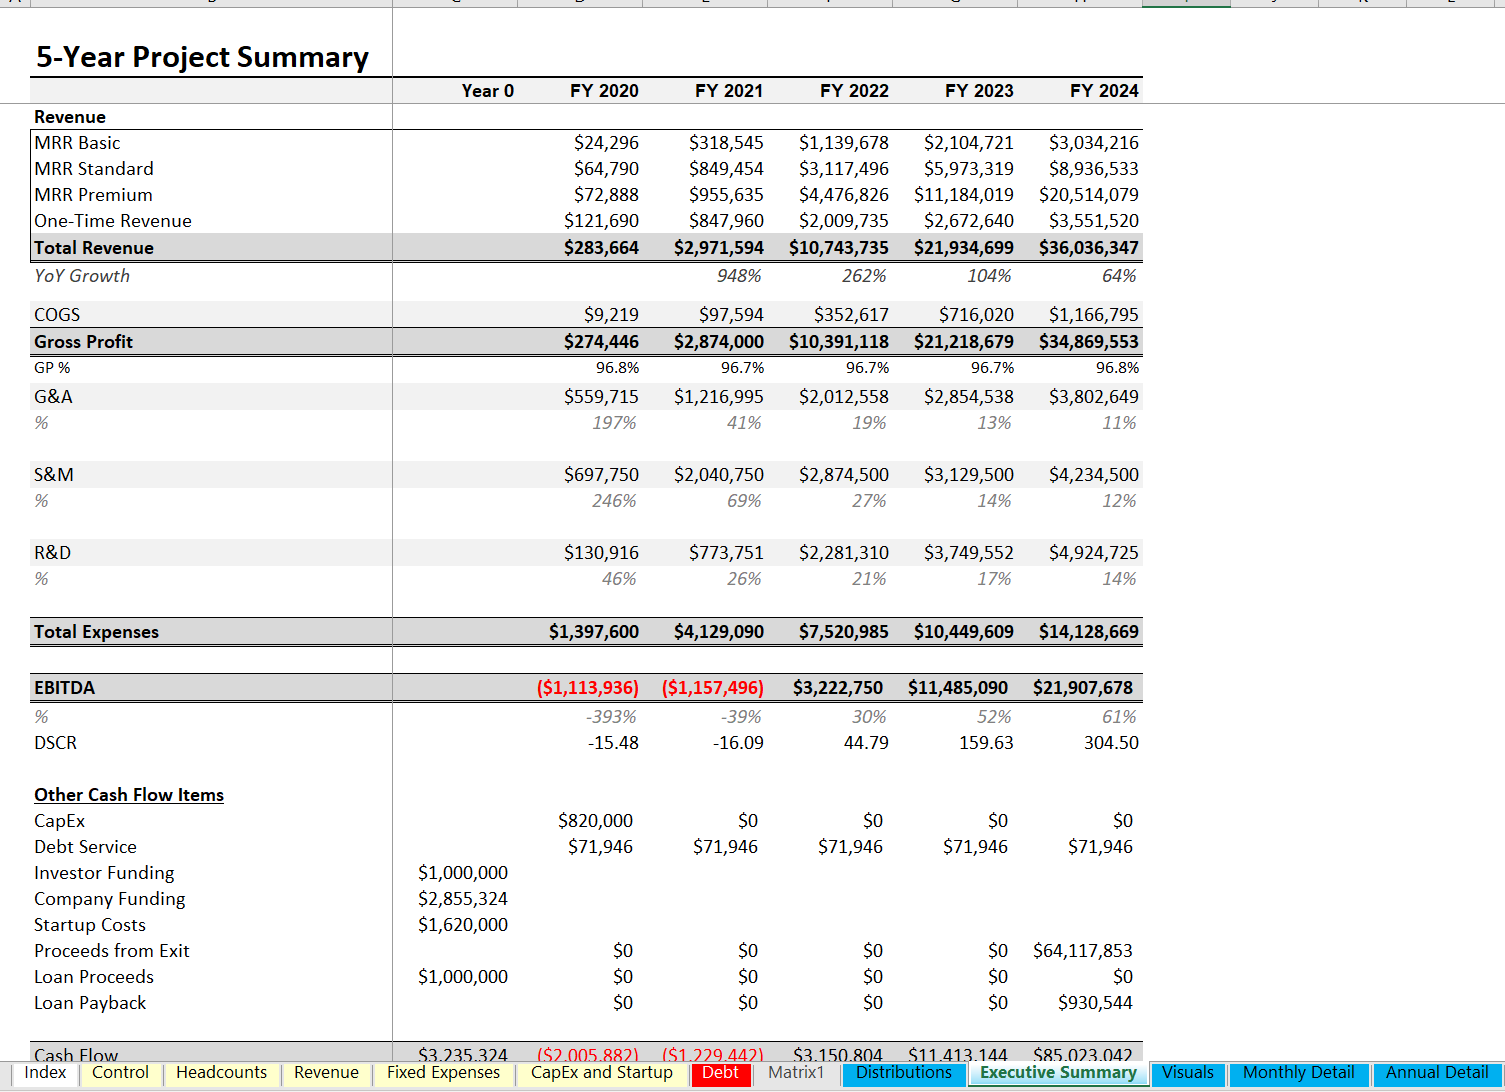
Startup SaaS Model Driven by SDR and AE Performance Ratios

Type of Business :

SAAS Products

Price : USD 125 125.00

Need More Clarifications/Customized Tool? Generate Ticket

Add to Wishlist icrest approved product

  • Short Description

    This excel template is driven by ratios of different sales and customer reps within the context of a SaaS business that gets most of their new customers by means of the activity of sales people. This startup model goes out for a period of 5 years on a monthly and annual basis.

  • Full Description

    To start off the model, the user can enter the start month and starting headcount of SDR (sales directors) and AE’s (Account Executives) as well as the monthly amount of each added over 5 years. A Deal Quota is defined for AE’s as well as the % of that deal quota the average AE will attain in the first 5 quarters they start working. The fully loaded salaries are definable per year for SDR, AE, and CS (customer service reps). Customer service reps use a ratio based on the number of new customers a single CS representative can handle in order to populate their headcount. Engineers headcounts are defined based on the percentage of revenue allocated to their department. Based on their fully loaded salaries against the revenue available to spend on them, the headcount is defined. There is a % to define type 1 vs. type 2 engineers. Three pricing tiers exist and there are configurable inputs for the % of new customers that fall into a given tier. Each pricing tier has its own churn rate that can change over time and there is an input for one-time setup fees the customer must pay. Fixed expenses, capex, and one-time startup costs all have their own schedules as well as costs of goods sold per user and cost of goods sold as a direct % of revenue. Based on all the assumptions, a 5-year monthly and annual P&L detail will populate automatically as well as an Executive Summary and Cash Distribution schedule that shows project cash flow as well as investor repayment and owner payouts if applicable. There are assumptions to account for debt service and terminal value as well. Common SaaS key metrics are displayed, including: CaC (customer acquisition cost), Month to Pay Back CaC, LTV (average customer lifetime value), LTV to CaC ratio, and annual revenue per employee. Visuals were built to show those as well as many financial highlights.

  • Table of Content
    No. Content
    Control Handle project level assumptions, equity shares, and debt assumptions.
    Headcounts Enter the ratios for employee types and their annual salaries as well as quotas for AE's.
    Revenue Enter assumptions about your revenue streams/pricing/churn/user logic.
    Fixed Expenses These are monthly recurring costs. Choose the start month and the monthly amount in each year.
    CapEx and Startup These are one-time costs that happen prior to operations (startup) or during the forecasted operations (capex).
    Debt Amortization schedule that shows debt payments if you plan on borrowing a p+I loan. Enter debt terms here.
    Matrix1 This is how the amount of total deals (user sign-ups) that happen per month based on AE counts/quota attainment.
    Distributions The cash flow distributions summary per year based on any investor equity / their share vs. owner share.
    Executive Summary A high-level overview of the financials per year.
    Visuals A wide range of visuals to display what your assumptions result in happening.
    Monthly Detail The monthly details of the result of all assumptions.
    Annual Detail The annual details of the result of all assumptions.
  • Reviews

    No Review. Write a review and be the first.

Related Products